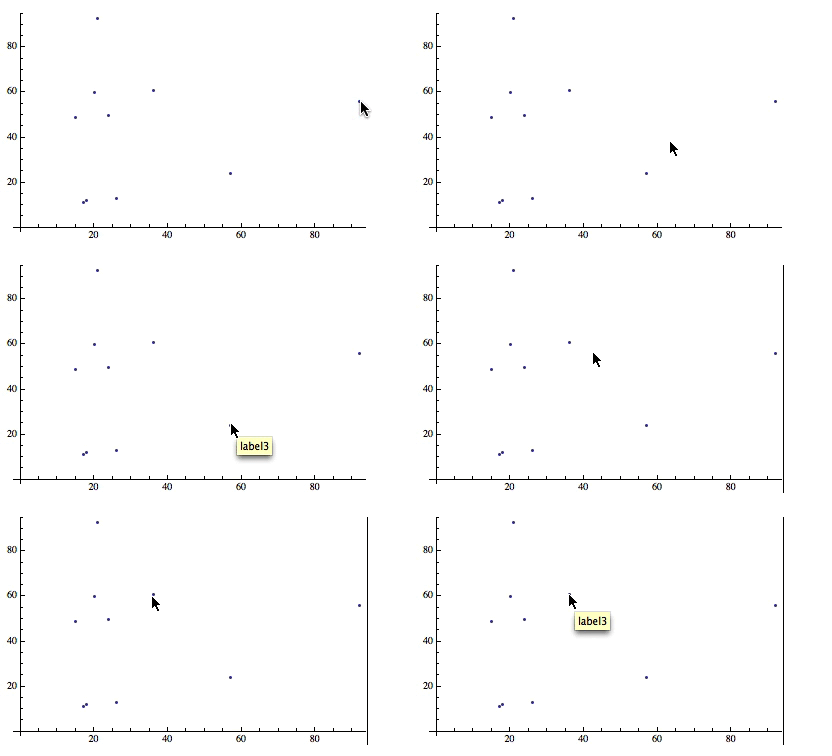
Based on update question: It seems that ListPlot cannot handle Tooltip "directly", so I used a Table to add a Tooltip to each point.
I use the following random data:
data = Append[#, RandomChoice[{"label1", "label2", "label3"}]] & /@
RandomInteger[100, {10, 2}]

(*{{80, 14, "label1"}, {98, 70, "label1"}, {66, 86, "label3"}, {43, 90,
"label2"}, {82, 29, "label2"}, {65, 91, "label1"}, {68, 59,
 "label3"}, {9, 56, "label1"}, {17, 50, "label2"}, {79, 99,
 "label3"}}*)
And then plot:
ListPlot[Table[Tooltip[data[[i, 1 ;; 2]], data[[i, 3]]], {i, Length@data}]]

Is this what you wanted?
EDIT
Based on Mr.Wizard's comment (see below), we can also concisely write:
ListPlot[Tooltip[{#, #2}, #3] & @@@ data]


ListPlot[Tooltip@Prime[Range[25]], Filling -> Axis]. Is that what you try to do? $\endgroup$tabof dimensions{100,3}and I want to use the first two columns for the plot and the third for the label. Do you know how to do that? $\endgroup$BubbleChart. $\endgroup$