3
$\begingroup$

I have the following list:

m={{14, "extinguisher"}, {54, "virgule"}, {55, "turnoff"}, {51, 
  "sofa"}, {77, "beachcomber"}, {61, "stoic"}, {6, 
  "isomorphism"}, {34, "leftist"}, {84, "spline"}, {42, 
  "heartiness"}, {35, "postnatal"}, {41, "stratified"}, {66, 
  "silkworm"}, {95, "conformance"}, {38, "hemophiliac"}, {19, 
  "abdication"}, {13, "reimpose"}, {82, "cowhide"}, {78, 
  "banteringly"}, {26, "contention"}};

I wonder if it is possible to make a spiral bubble chart of this on Mathematica, where the number is represented by how the bubble should be big and each bubble would be labeled by the corresponding words.

In fact I am expecting to make something as follow: enter image description here

$\endgroup$
4
  • $\begingroup$ What determines the location of each "dot"? $\endgroup$ Commented Dec 18, 2018 at 16:20
  • $\begingroup$ @DavidG.Stork it should be in spiral. So this is the actual question, how to make an algorithm which can locate the circles based on size on a spiral. $\endgroup$
    – Wiliam
    Commented Dec 18, 2018 at 16:27
  • $\begingroup$ Are the dots ordered in descending sizes? $\endgroup$ Commented Dec 18, 2018 at 16:33
  • $\begingroup$ On the picture yes they are. but in list m they are not ordered but I think one can order them using Sort $\endgroup$
    – Wiliam
    Commented Dec 18, 2018 at 16:41

3 Answers 3

7
$\begingroup$

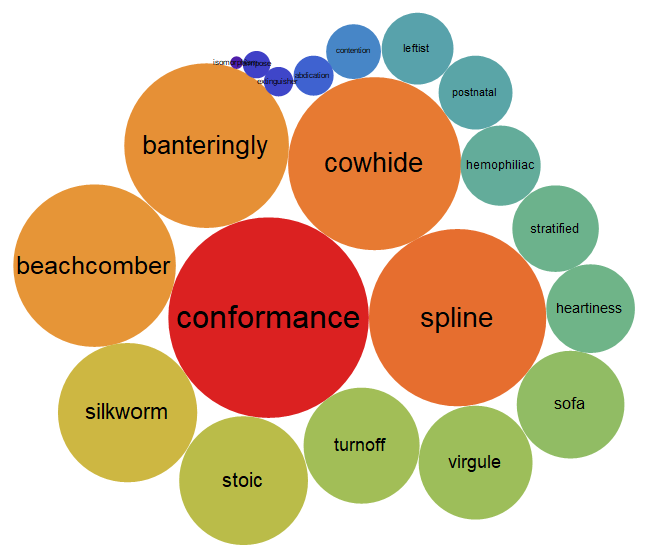
Using the function spiral from this answer by Heike to compute the centers of disks arranged on a spiral:

sm = SortBy[m, -#[[1]] &];
radii = Normalize[sm[[All, 1]], Max] ;
centers = spiral[radii];
labels = sm[[All, 2]];
Graphics[MapThread[{ColorData["Rainbow"]@#3, Disk[##2], Black, 
    Text[Style[#, Max[8, Floor[32 #3]]], #2]} &, {labels, centers, radii}]]

enter image description here

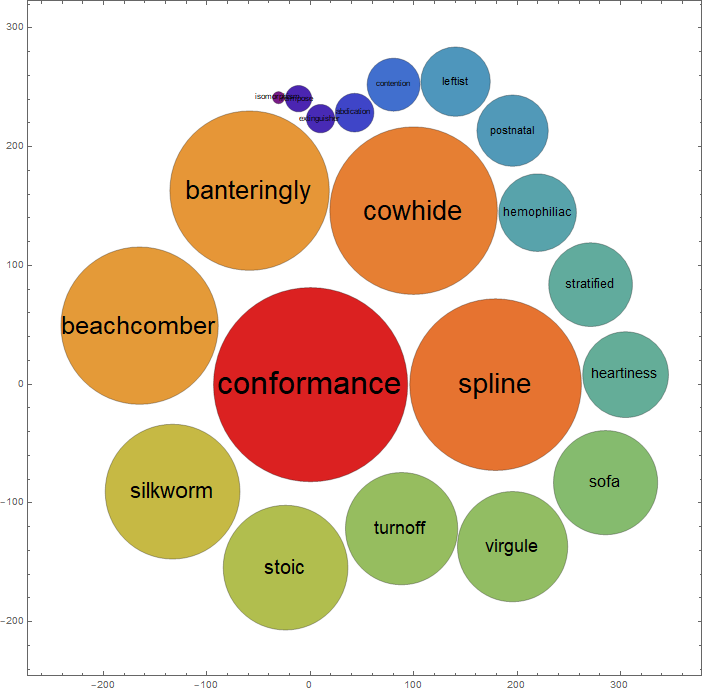
Alternatively, use spiral to construct input data for BubbleChart:

BubbleChart[MapThread[Append, {spiral[sm[[All, 1]]], sm[[All, 1]]}], 
 BubbleScale -> "Diameter",  BubbleSizes -> {.025, .4}, 
 ColorFunction -> "Rainbow", 
 ChartLabels -> Placed[Style[#, Max[8, Floor[32 #2]]] & @@@ 
    Transpose[{labels, Normalize[sm[[All, 1]], Max]}], Center]]

enter image description here

$\endgroup$
6
$\begingroup$

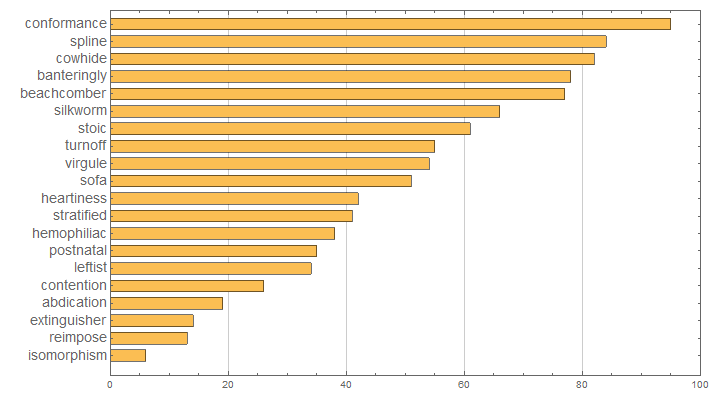
This is an answer but might likely be interpreted as just a comment: If you want to construct a spiral bubble chart as an example of poor information transfer, then by all means go for it. If not, don't do it. For such data a simple bar chart might be your best bet.

m = Sort[m]

BarChart[m[[All, 1]], BarOrigin -> Left, 
 ChartLabels -> (Style[#, 14] &) /@ m[[All, 2]],
 BarSpacing -> Large, GridLines -> Automatic, Frame -> True]

enter image description here

Reluctant edit

@march is right. Some things are interesting to program even when there are no apparent redeeming social aspects of the result. If the objective is to confuse or get puzzled looks, here is one way to construct that uninformative/confusing figure.

(* Sort the data from high to low - assuming values are proportional to area *)
m = {{14, "extinguisher"}, {54, "virgule"}, {55, "turnoff"}, {51, 
    "sofa"}, {77, "beachcomber"}, {61, "stoic"}, {6, 
    "isomorphism"}, {34, "leftist"}, {84, "spline"}, {42, 
    "heartiness"}, {35, "postnatal"}, {41, "stratified"}, {66, 
    "silkworm"}, {95, "conformance"}, {38, "hemophiliac"}, {19, 
    "abdication"}, {13, "reimpose"}, {82, "cowhide"}, {78, 
    "banteringly"}, {26, "contention"}};
m = -Sort[-m];

(* Determine associated relative radius *)
r = m[[All, 1]]^0.5;
r = r/Max[r];

(* Make array to hold coordinates of circle centers *)
xy = ConstantArray[{0, 0}, Length[r]];
(* Set the coordinates of the second circle just to the right of the first circle *)
xy[[2]] = {r[[1]] + r[[2]], 0};

(* Function that determines the coordinates of the i-th circle *)
coordinates[base_, i_] := Module[{sol, rMatrix, rxy},
  sol = NSolve[{(x - xy[[base, 1]])^2 + (y - xy[[base, 2]])^2 == (r[[base]] + r[[i]])^2,
     (x - xy[[i - 1, 1]])^2 + (y - xy[[i - 1, 2]])^2 == (r[[i - 1]] +  r[[i]])^2}, {x, y}];
  (* Choose the solution that will be counter-clockwise to the previous circle *)
  rMatrix = RotationMatrix[-ArcTan[xy[[i - 1, 1]], xy[[i - 1, 2]]]];
 rxy1 = rMatrix.{x, y} /. sol[[1]];
 rxy2 = rMatrix.{x, y} /. sol[[2]];
 If[ArcTan[rxy1[[1]], rxy1[[2]]] >= ArcTan[rxy2[[1]], rxy2[[2]]], {x, y} /. sol[[1]], {x, y} /. 
 sol[[2]]]]


base = 1;  (* base is the index of the circle to which the next circle will touch *)
(* It is assumed the the current circle will always touch the previous circle *)
Do[
 xy[[i]] = coordinates[base, i];
 (* Is there any overlap with previous circles? *)
 (* If so, make the base circle next in the list *)
 overlap = False;
 Do[If[(xy[[i, 1]] - xy[[j, 1]])^2 + (xy[[i, 2]] - xy[[j, 2]])^2 < 
   (r[[i]] + r[[j]])^2, overlap = True], {j, 1, i - 1}];
 If[overlap, base = base + 1; xy[[i]] = coordinates[base, i]],
 {i, 3, Length[m]}]

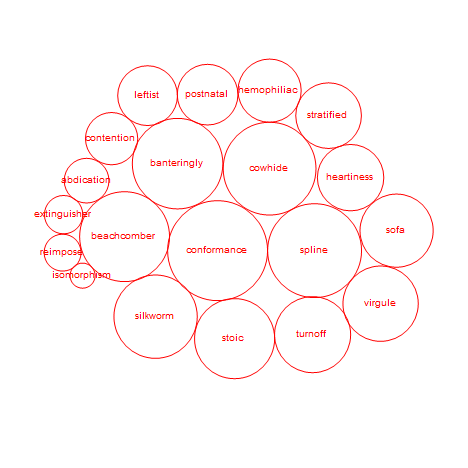
Show[ListPlot[xy, PlotStyle -> White, AspectRatio -> 1, 
  PlotRange -> {1.4 MinMax[xy], 1.4 MinMax[xy]}, Axes -> False],
 Graphics[Flatten[{Red, Table[{Text[m[[i, 2]], xy[[i]]], Circle[xy[[i]], r[[i]]]}, 
   {i, Length[m]}]}]]]

Sprial bubble chart

$\endgroup$
2
  • 5
    $\begingroup$ I agree. Simplicity in data presentation is a must. Aside from this, OP's problem is still an interesting one. $\endgroup$
    – march
    Commented Dec 18, 2018 at 18:02
  • $\begingroup$ @march I know what you mean. At this forum and throughout my consulting career I see stuff that shouldn't be done - however, the programming/logic involved in implementing such silly things can be very interesting. $\endgroup$
    – JimB
    Commented Dec 18, 2018 at 21:50
2
$\begingroup$

Edit:

m = Sort[{{14, "extinguisher"}, {54, "virgule"}, {55, "turnoff"}, {51,
      "sofa"}, {77, "beachcomber"}, {61, "stoic"}, {6, 
     "isomorphism"}, {34, "leftist"}, {84, "spline"}, {42, 
     "heartiness"}, {35, "postnatal"}, {41, "stratified"}, {66, 
     "silkworm"}, {95, "conformance"}, {38, "hemophiliac"}, {19, 
     "abdication"}, {13, "reimpose"}, {82, "cowhide"}, {78, 
     "banteringly"}, {26, "contention"}}];
rad = m[[All, 1]];
center = CirclePoints[50, 20];


Show[Table[
  Graphics[{ColorData["ThermometerColors"][
     Rescale[rad[[i]], MinMax@rad]], 
    Disk[center[[i]], (rad[[i]])^(1/2.1)], 
    Text[Style[m[[i, 2]], Black], center[[i]]]}], {i, Length@rad}]]
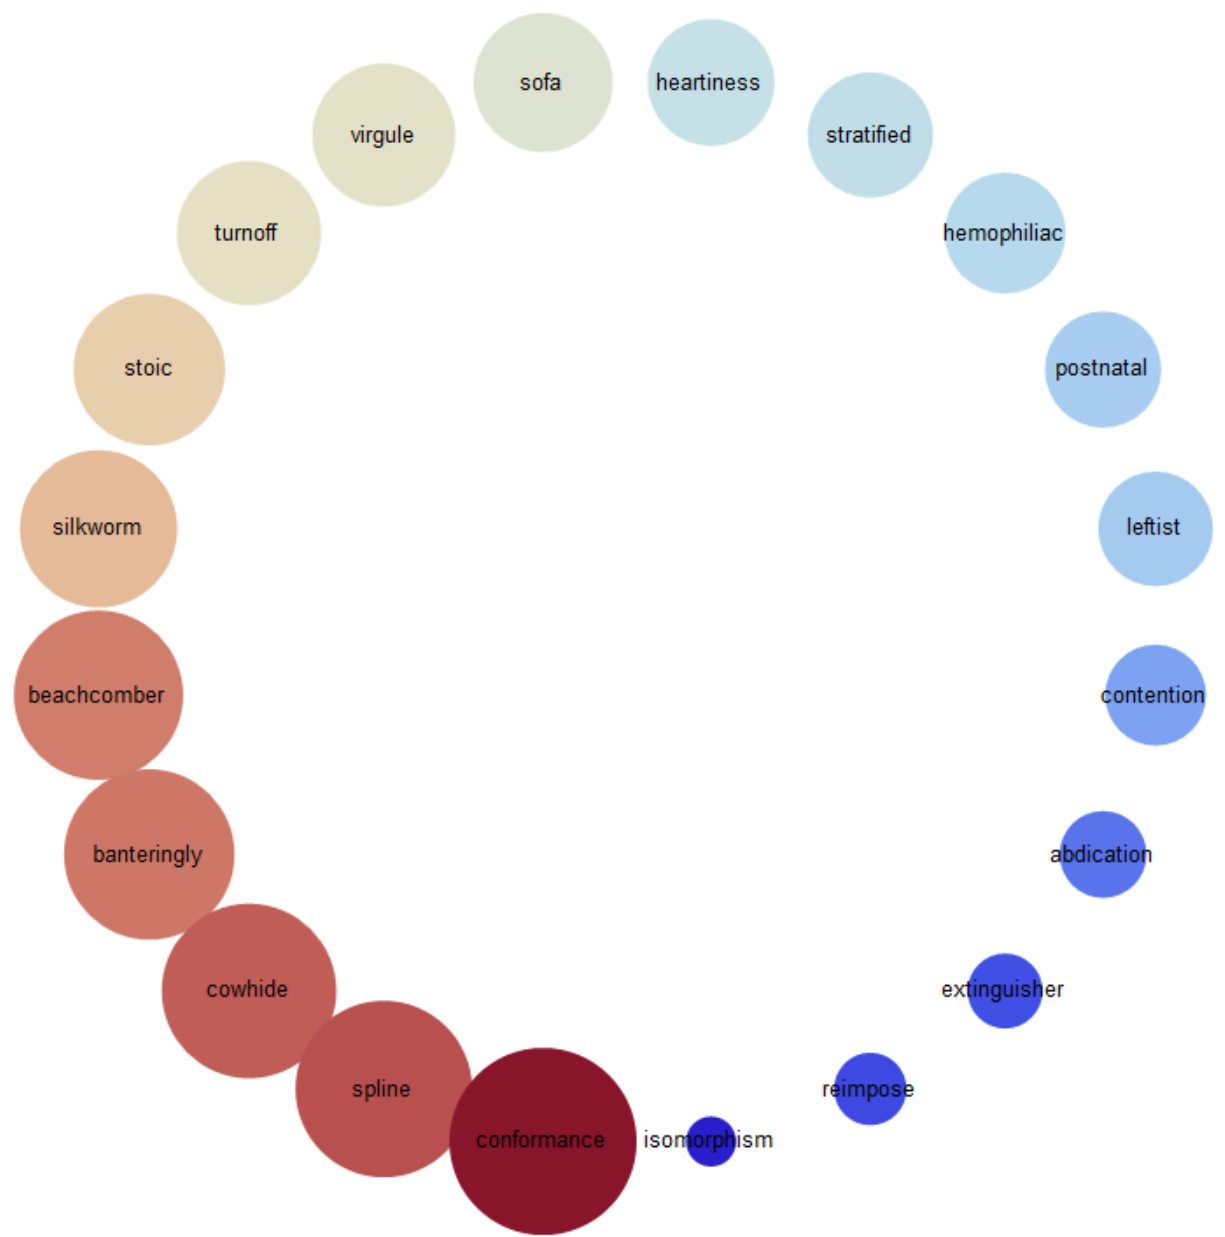
enter image description here Original answer:

Here is my attempt. It is not elegant. Note this is misleading!!

    m = Sort[{{14, "extinguisher"}, {54, "virgule"}, {55, "turnoff"}, {51,
      "sofa"}, {77, "beachcomber"}, {61, "stoic"}, {6, 
     "isomorphism"}, {34, "leftist"}, {84, "spline"}, {42, 
     "heartiness"}, {35, "postnatal"}, {41, "stratified"}, {66, 
     "silkworm"}, {95, "conformance"}, {38, "hemophiliac"}, {19, 
     "abdication"}, {13, "reimpose"}, {82, "cowhide"}, {78, 
     "banteringly"}, {26, "contention"}}];
rad = m[[;; -2, 1]];
center = CirclePoints[40, 19];


Show[Graphics[{RGBColor[0.6, 0, 0], 
   Disk[{0, 0}, (m[[-1, 1]])^(1/1.3)], 
   Text[Style[m[[-1, 2]], Black], {0, 0}]}], 
 Table[Graphics[{ColorData["ThermometerColors"][
     Rescale[rad[[i]], MinMax@rad]], 
    Disk[center[[i]], (rad[[i]])^(1/2.1)], 
    Text[Style[m[[i, 2]], Black], center[[i]]]}, Frame -> True], {i, 
   Length@rad}]]
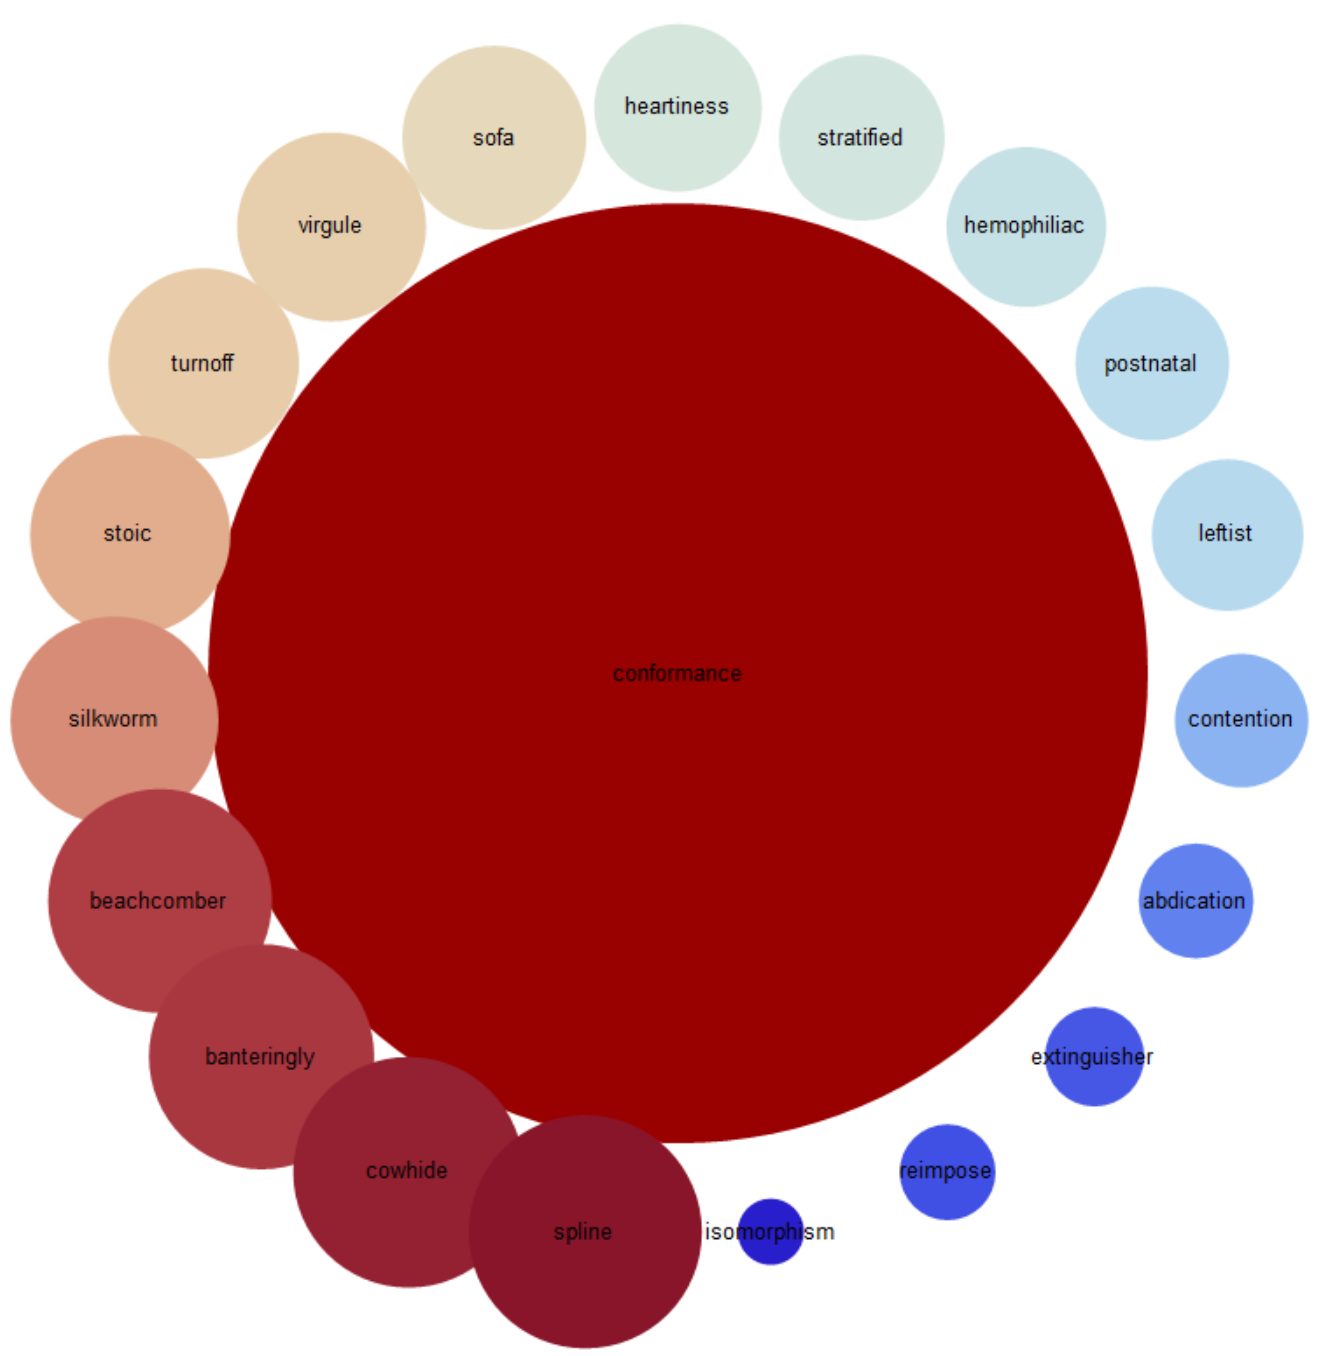
enter image description here

$\endgroup$

Your Answer

By clicking “Post Your Answer”, you agree to our terms of service and acknowledge you have read our privacy policy.

Not the answer you're looking for? Browse other questions tagged or ask your own question.