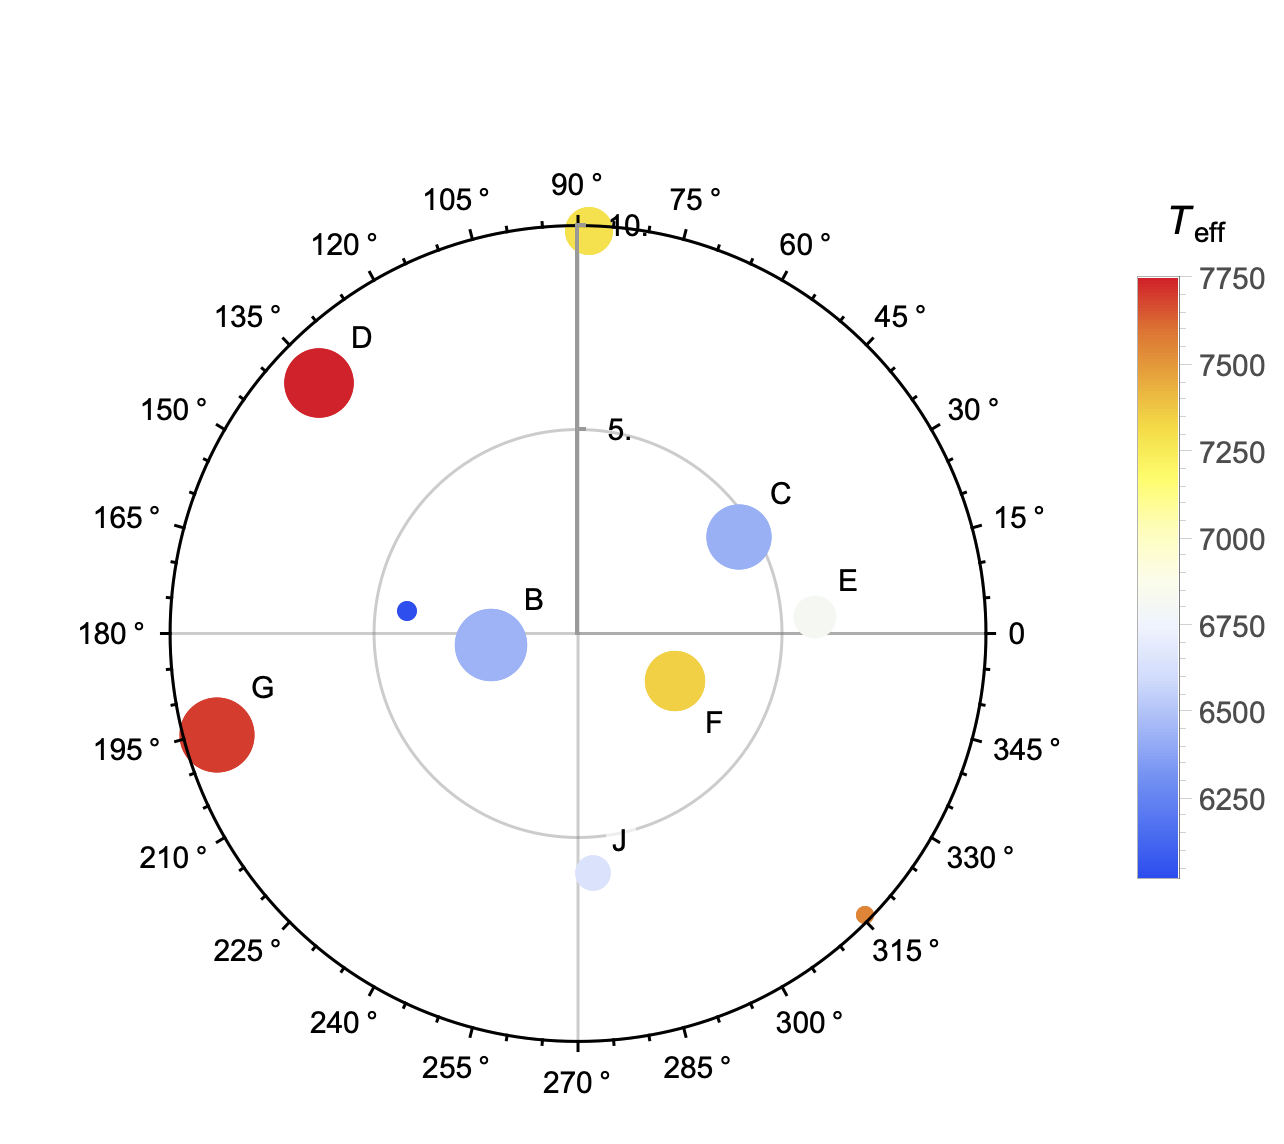
I would like to create a plot similar to that in the figure 1. I tried using both ListPolarPlot and BubbleChart, but they do not have the right option for creating a polar bubble chart. Any suggestion?
3 Answers
Assuming that the data is formatted as {theta, r, size, temperature}
SeedRandom[1234]
n = 10;
data = Transpose@{
    RandomReal[{0, 2 Pi}, n] (* theta *),
    RandomReal[{0, 10}, n] (* radius *),
    RandomReal[{1, 5}, n] (* size *),
    RandomReal[{6000, 8000}, n] (* temperature *)};

labels = {None, "B", "C", "D", "E", "F", "G", None, None, "J"};

{minSize, maxSize} = MinMax[data[[All, 3]]];
{minBubble, maxBubble} = {6, 25};

{minTemp, maxTemp} = MinMax[data[[All, 4]]];

Legended[
 ListPolarPlot[
  List /@
   (Labeled @@@ Transpose[{data[[All, 1 ;; 2]], labels}]),
  PlotStyle -> (Directive[
       AbsolutePointSize[Rescale[#[[1]],
         {minSize, maxSize},
         {minBubble, maxBubble}]],
       ColorData["TemperatureMap"][Rescale[#[[2]],
         {minTemp, maxTemp}]]] & /@
     data[[All, 3 ;; 4]]),
  PolarAxes -> True,
  PolarTicks -> {"Degrees", {5, 10}},
  PolarGridLines -> {Range[0, 360 Degree, 90 Degree], {5, 10}},
  PlotRangePadding -> Scaled[.2]],
 BarLegend[{"TemperatureMap", {minTemp, maxTemp}},
  LegendLabel -> Subscript[Style["T", Italic], "eff"]]]
-
$\begingroup$ Thank you. Just one little thing... the color of each data point should be related with the temperature, as the data are {theta, r, size, temperature}. $\endgroup$ Commented Aug 1, 2020 at 8:31
-
$\begingroup$ Edited. In the future provide sample data and explain in words what you want. A plot "similar" to a linked plot is not descriptive. $\endgroup$ Commented Aug 1, 2020 at 14:31
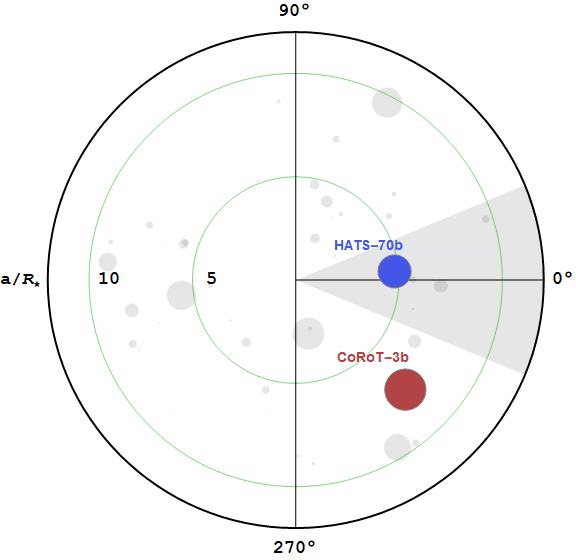
You could use ListPolarPlot and change the marker size. But if you want it to look as close as possible to that plot then you may need to build it up manually with Graphics elements. Here is something I made to get you started. Hopefully you or somebody interested can improve it and build a more flexible chart that works with a variety of data and plot ranges ( remove the magic numbers ):
SeedRandom[12345];
grayPos = RandomPoint[Disk[{0, 0}, 10], 50];
grayRadii = RandomVariate[ExponentialDistribution[5], 50];
grayDisks = MapThread[Disk[#1, #2] &, {grayPos, grayRadii}];

tempcol[temp_] :=
 ColorData[{"ThermometerColors", "Reverse"}][
  Rescale[Clip[temp, {6000, 8000}], {6000, 8000}]]
datapoint[radius_, temp_, angle_, distance_, label_] :=
 Block[{pos = {Cos[angle], Sin[angle]}*distance},
  {EdgeForm[Gray], FaceForm[tempcol[temp]], Disk[pos, radius],
   Text[Style[label, tempcol[temp], FontFamily -> "Arial",
     FontWeight -> Bold, FontSize -> 14], pos + radius*{-3/2, 3/2}]}]

data = {{1, 6200, -45 Degree, 7.5, "CoRoT-3b"},
   {.8, 7800, 5 Degree, 4.8, "HATS-70b"}};

Graphics[{
  {Opacity[.1], grayDisks},
  {Opacity[.1], Disk[{0, 0}, 12, {\[Pi]/8, -\[Pi]/8}]},
  {Thick, Circle[{0, 0}, 12]},
  {Thin, Opacity[.5], Darker@Green, Circle[{0, 0}, 10]},
  {Thin, Opacity[.5], Darker@Green, Circle[{0, 0}, 5]},
  MapThread[
   Text[Style[#1, FontFamily -> "Courier", FontWeight -> Bold,
      FontSize -> 18], #2] &, {{"5", "10"}, {{-4, 0}, {-9, 0}}}],
  {Line[{{0, -12}, {0, 12}}]},
  {Line[{{0, 0}, {12, 0}}]},
  {datapoint @@@ data},
  MapThread[
   Text[Style[#1, FontFamily -> "Courier", FontWeight -> Bold,
      FontSize -> 18], #2] &, {{"90\[Degree]",
     "a/\!\(\*SubscriptBox[\(R\), \(\[Star]\)]\) ", "270\[Degree]",
     "0\[Degree]"}, CirclePoints[{13, \[Pi]/2}, 4]}]
  }, ImageSize -> Large]
Using data from Bob Hanlon's answer:
SeedRandom[1234]
n = 10;
data = Transpose@{RandomReal[{0, 2 Pi}, n], RandomReal[{0, 5}, n],
    RandomReal[{1, 5}, n], RandomReal[1, n]};
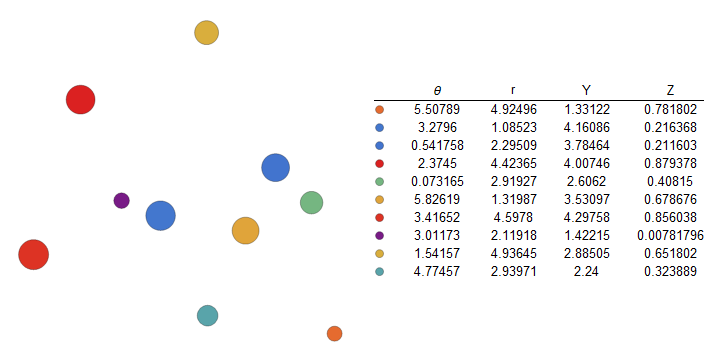
Pre-process data into a form that can be used with BubbleChart:
bc = BubbleChart[{Append[#2 {Cos@#, Sin@#}, #3]} & @@@ data,
   BubbleSizes -> {0.05, 0.1},
   ChartStyle -> (ColorData["Rainbow"] /@ Rescale[data[[All, 4]]]),
   Frame -> False,
   ChartLegends -> SwatchLegend[ToString /@ data[[All, 3 ;;]],
     LegendMarkers -> "Bubble",
     LegendLayout -> (TableForm[Join[List /@ #[[All, 1]], data, 2],
       TableHeadings -> {None, {"", "θ", "r", "Y", "Z"}}, TableAlignments -> Center] &)]]
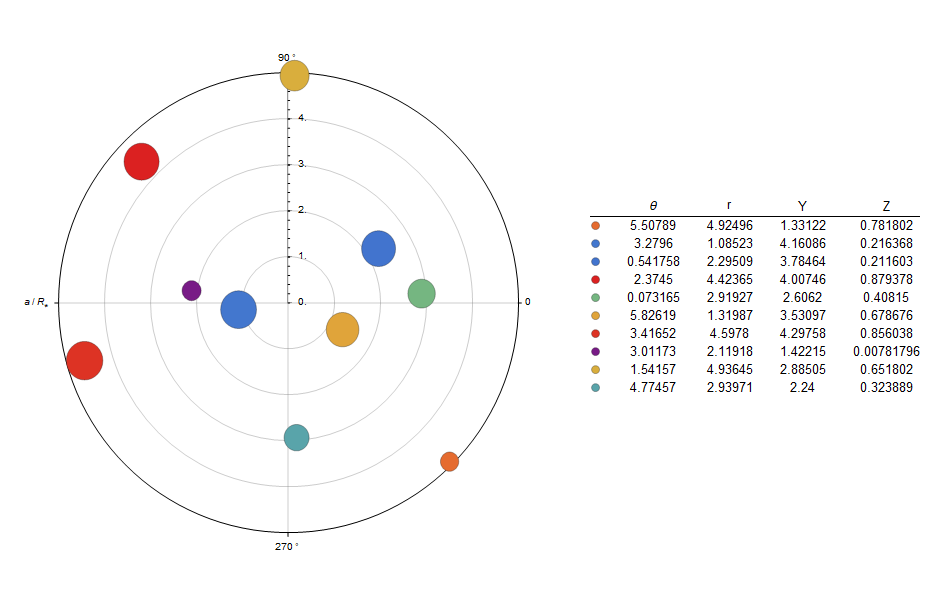
To add polar axes/ticks/gridlines use ListPolarPlot with desired options:
lpp = ListPolarPlot[MinMax[data[[All, 2]]],
   PlotStyle -> None,
   PolarAxes -> {True, True},
   PolarTicks -> {{0 , 90, 180, 270} Degree /.
      180 Degree -> {180 Degree, Row[{a, Subscript[R, "*"]}, "/"]},
     Automatic}, PolarGridLines -> Automatic];

Show[lpp, bc, ImageSize -> Large]
-
$\begingroup$ Thank you for this solution. $\endgroup$ Commented Aug 1, 2020 at 15:49


