3
$\begingroup$

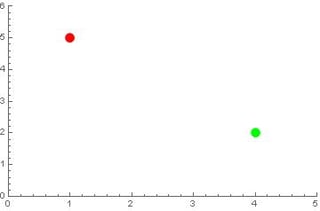
I have a plot as below:

ListPlot[{{{1, 5}}, {{4, 2}}}, PlotStyle -> {{Red, PointSize[0.03]}, {Green, PointSize[0.03]}}, PlotRange -> {{0, 5}, {0, 6}}]

enter image description here

I want to add black circular boundaries for the red and green spots. What can I do?

Many thanks!

$\endgroup$

1 Answer 1

3
$\begingroup$
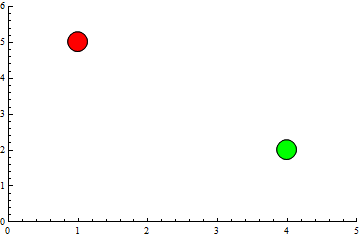
ListPlot[{{{1, 5}}, {{4, 2}}}, 
 PlotStyle -> {Red, Green}, 
 PlotRange -> {{0, 5}, {0, 6}}, 
 PlotMarkers -> {Graphics[{EdgeForm[Black], Disk[]}], .1}]

enter image description here

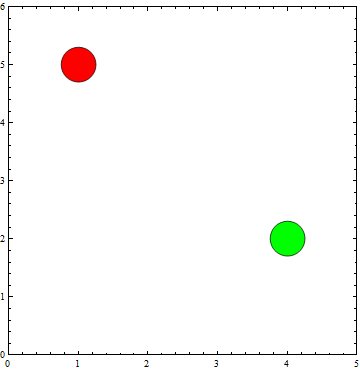
BubbleChart[{{1, 5, .3}, {4, 2, .3}}, ChartStyle -> {Red, Green}, 
 PlotRange -> {{0, 5}, {0, 6}}]

enter image description here

$\endgroup$
3
  • $\begingroup$ Thanks for your reply. Is it possible to add black at the boundary only instead of adding black at the back? What I want to do is to use Opacity[0], Red instead of just Red to make it transparent, and then add the spots to another plot. So if the black is at the back, there will be no transparency. $\endgroup$
    – H42
    Commented Jul 26, 2018 at 17:31
  • 1
    $\begingroup$ @H42, with EdgeForm[Black] only the edge of the disk is painted black, not the whole disk. $\endgroup$
    – kglr
    Commented Jul 26, 2018 at 17:33
  • $\begingroup$ Oh sorry I mixed up the codes. many thanks! $\endgroup$
    – H42
    Commented Jul 26, 2018 at 17:41

Your Answer

By clicking “Post Your Answer”, you agree to our terms of service and acknowledge you have read our privacy policy.

Not the answer you're looking for? Browse other questions tagged or ask your own question.