added 196 characters in body
Source Link
kglr
  • 400.5k
  • 18
  • 488
  • 929
ListPlot[{{{1, 5}}, {{4, 2}}}, 
 PlotStyle -> {Red, Green}, 
 PlotRange -> {{0, 5}, {0, 6}}, 
 PlotMarkers -> {Graphics[{EdgeForm[Black], Disk[]}], .1}]

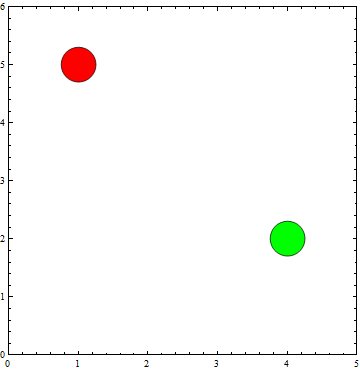
enter image description here

BubbleChart[{{1, 5, .3}, {4, 2, .3}}, ChartStyle -> {Red, Green}, 
 PlotRange -> {{0, 5}, {0, 6}}]

enter image description here

ListPlot[{{{1, 5}}, {{4, 2}}}, 
 PlotStyle -> {Red, Green}, 
 PlotRange -> {{0, 5}, {0, 6}}, 
 PlotMarkers -> {Graphics[{EdgeForm[Black], Disk[]}], .1}]

enter image description here

ListPlot[{{{1, 5}}, {{4, 2}}}, 
 PlotStyle -> {Red, Green}, 
 PlotRange -> {{0, 5}, {0, 6}}, 
 PlotMarkers -> {Graphics[{EdgeForm[Black], Disk[]}], .1}]

enter image description here

BubbleChart[{{1, 5, .3}, {4, 2, .3}}, ChartStyle -> {Red, Green}, 
 PlotRange -> {{0, 5}, {0, 6}}]
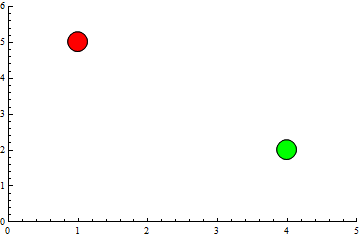
enter image description here

Source Link
kglr
  • 400.5k
  • 18
  • 488
  • 929

ListPlot[{{{1, 5}}, {{4, 2}}}, 
 PlotStyle -> {Red, Green}, 
 PlotRange -> {{0, 5}, {0, 6}}, 
 PlotMarkers -> {Graphics[{EdgeForm[Black], Disk[]}], .1}]

enter image description here