1
$\begingroup$

I’m totally new to Mathlab. I have the following ‘grid data’ to be read from ‘Office Excel’ that I need them to be drawn as a surface in the Mathematica or Mathlab.

[[DATA PICTURE]]

I’ve done this with the ‘Surface’ application; but, I’m not satisfied with the output. I do love the way the ‘Mathlab’ or the ‘Mathemaica’ draw these things with their unique and gorgeous outputs.

[[SURFER OUTPUT]]

I can get a ‘.grd’ file from an ‘.xlsx’ (Excel) using the ‘Surface’ application to do the 3D drawings; but, I do want them to be drawn using ‘Mathlab’ or ‘Mathematica’; how to do that?

My all data in the ‘.xlsx’ file with the form {x, y, z}:

{0, -42, 9.154647E+13}, {9.09327, -36.75, 9.614679E+13}, {18.18653, -31.5, 9.950809E+13}, {27.2798, -26.25, 9.617123E+13}, {36.37306, -21, 9.159174E+13}, {-9.09327, -36.75, 9.610033E+13}, {0, -31.5, 9.982879E+13}, {9.09327, -26.25, 1.066651E+14}, {18.18653, -21, 1.066760E+14}, {27.2798, -15.75, 9.985912E+13}, {36.37306, -10.5, 9.615046E+13}, {-18.18653, -31.5, 9.941883E+13}, {-9.09327, -26.25, 1.066308E+14}, {0, -21, 1.180334E+14}, {9.09327, -15.75, 1.226739E+14}, {18.18653, -10.5, 1.180546E+14}, {27.2798, -5.25, 1.066687E+14}, {36.37306, 0, 9.947475E+13}, {-27.2798, -26.25, 9.604409E+13}, {-18.18653, -21, 1.066111E+14}, {-9.09327, -15.75, 1.226429E+14}, {0, -10.5, 1.363291E+14}, {9.09327, -5.25, 1.363397E+14}, {18.18653, 0, 1.226722E+14}, {27.2798, 5.25, 1.066531E+14}, {36.37306, 10.5, 9.610285E+13}, {-36.37306, -21, 9.142813E+13}, {-27.2798, -15.75, 9.976877E+13}, {-18.18653, -10.5, 1.179963E+14}, {-9.09327, -5.25, 1.363113E+14}, {0, 0, 1.571756E+14}, {9.09327, 5.25, 1.363308E+14}, {18.18653, 10.5, 1.180302E+14}, {27.2798, 15.75, 9.980929E+13}, {36.37306, 21, 9.148295E+13}, {-36.37306, -10.5, 9.602540E+13}, {-27.2798, -5.25, 1.065873E+14}, {-18.18653, 0, 1.226169E+14}, {-9.09327, 5.25, 1.363036E+14}, {0, 10.5, 1.363138E+14}, {9.09327, 15.75, 1.226445E+14}, {18.18653, 21, 1.066221E+14}, {27.2798, 26.25, 9.605668E+13}, {-36.37306, 0, 9.935848E+13}, {-27.2798, 5.25, 1.065738E+14}, {-18.18653, 10.5, 1.179760E+14}, {-9.09327, 15.75, 1.226173E+14}, {0, 21, 1.179992E+14}, {9.09327, 26.25, 1.066114E+14}, {18.18653, 31.5, 9.939575E+13}, {-36.37306, 10.5, 9.598052E+13}, {-27.2798, 15.75, 9.972668E+13}, {-18.18653, 21, 1.065676E+14}, {-9.09327, 26.25, 1.065856E+14}, {0, 31.5, 9.977488E+13}, {9.09327, 36.75, 9.605066E+13}, {-36.37306, 21, 9.133061E+13}, {-27.2798, 26.25, 9.595305E+13}, {-18.18653, 31.5, 9.933475E+13}, {-9.09327, 36.75, 9.602483E+13}, {0, 42, 9.146442E+13}
$\endgroup$
6
  • 3
    $\begingroup$ What have you tried? $\endgroup$
    – xzczd
    Commented Jun 25, 2018 at 5:32
  • $\begingroup$ I used tri = delaunay(x,y); trisurf(tri,x,y,z), where x, y and z are my columns in the excel file, but the result is not what I want. and in Mathematica I used ListPlot3D[data, Mesh -> None, InterpolationOrder -> 3] command, where the data is my x, y and z. and the result is totally different! $\endgroup$
    – Qaher
    Commented Jun 25, 2018 at 6:23
  • 2
    $\begingroup$ This site is abouth Mathematica, not MATLAB - if you are not using Mathematica, this question will be closed. Please specify. $\endgroup$
    – Yves Klett
    Commented Jun 25, 2018 at 6:24
  • $\begingroup$ @YvesKlett I'm using both and in this site, I need Mathematica codes to achieve the same result as Surfer. $\endgroup$
    – Qaher
    Commented Jun 25, 2018 at 6:29
  • $\begingroup$ Please show us the data, in copyable form. Without knowing what the data is, it's hard to tell what's wrong. $\endgroup$
    – xzczd
    Commented Jun 25, 2018 at 6:34

1 Answer 1

4
$\begingroup$

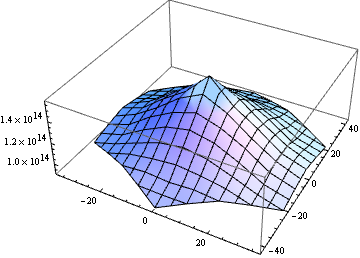
Your data is not properly imported: things like 9.614679E+13 are not valid number in Mathematica. Once again, without knowing how you imported the data, it's hard to tell what's wrong, so here I'll just fix the erroneous data:

dat = ToExpression@StringReplace[#, "E+" -> "*10^"] &@"{{0,-42,9.154647E+13},{9.09327,-36.75,9.614679E+13},{18.18653,-31.5,9.950809E+13},{27.2798,-26.25,9.617123E+13},{36.37306,-21,9.159174E+13},{-9.09327,-36.75,9.610033E+13},{0,-31.5,9.982879E+13},{9.09327,-26.25,1.066651E+14},{18.18653,-21,1.066760E+14},{27.2798,-15.75,9.985912E+13},{36.37306,-10.5,9.615046E+13},{-18.18653,-31.5,9.941883E+13},{-9.09327,-26.25,1.066308E+14},{0,-21,1.180334E+14},{9.09327,-15.75,1.226739E+14},{18.18653,-10.5,1.180546E+14},{27.2798,-5.25,1.066687E+14},{36.37306,0,9.947475E+13},{-27.2798,-26.25,9.604409E+13},{-18.18653,-21,1.066111E+14},{-9.09327,-15.75,1.226429E+14},{0,-10.5,1.363291E+14},{9.09327,-5.25,1.363397E+14},{18.18653,0,1.226722E+14},{27.2798,5.25,1.066531E+14},{36.37306,10.5,9.610285E+13},{-36.37306,-21,9.142813E+13},{-27.2798,-15.75,9.976877E+13},{-18.18653,-10.5,1.179963E+14},{-9.09327,-5.25,1.363113E+14},{0,0,1.571756E+14},{9.09327,5.25,1.363308E+14},{18.18653,10.5,1.180302E+14},{27.2798,15.75,9.980929E+13},{36.37306,21,9.148295E+13},{-36.37306,-10.5,9.602540E+13},{-27.2798,-5.25,1.065873E+14},{-18.18653,0,1.226169E+14},{-9.09327,5.25,1.363036E+14},{0,10.5,1.363138E+14},{9.09327,15.75,1.226445E+14},{18.18653,21,1.066221E+14},{27.2798,26.25,9.605668E+13},{-36.37306,0,9.935848E+13},{-27.2798,5.25,1.065738E+14},{-18.18653,10.5,1.179760E+14},{-9.09327,15.75,1.226173E+14},{0,21,1.179992E+14},{9.09327,26.25,1.066114E+14},{18.18653,31.5,9.939575E+13},{-36.37306,10.5,9.598052E+13},{-27.2798,15.75,9.972668E+13},{-18.18653,21,1.065676E+14},{-9.09327,26.25,1.065856E+14},{0,31.5,9.977488E+13},{9.09327,36.75,9.605066E+13},{-36.37306,21,9.133061E+13},{-27.2798,26.25,9.595305E+13},{-18.18653,31.5,9.933475E+13},{-9.09327,36.75,9.602483E+13},{0,42,9.146442E+13}}";

ListPlot3D@dat

Mathematica graphics

$\endgroup$
1
  • 1
    $\begingroup$ Wow, Thank you, and we can use PlotLegends -> Automatic option to get the same result with surfer, (maybe a more gorgeous output). $\endgroup$
    – Qaher
    Commented Jun 25, 2018 at 9:55

Your Answer

By clicking “Post Your Answer”, you agree to our terms of service and acknowledge you have read our privacy policy.

Not the answer you're looking for? Browse other questions tagged or ask your own question.