2
$\begingroup$

I have a file with three columns, space separated. First column is x, the second is the data, and the third is the standard deviation I computed of that data.

Now I want to plot in Mathematica, and want the standard deviation on top of the data points.

How do I do that by importing the file ?

$\endgroup$
7
  • 3
    $\begingroup$ Look at ErrorListPlot. $\endgroup$
    – Lukas Lang
    Commented Jun 24, 2018 at 16:59
  • $\begingroup$ For the close voters. The non-trivial part, that is not in the documentation, is formatting the data properly. $\endgroup$
    – rhermans
    Commented Jun 24, 2018 at 17:58
  • $\begingroup$ I haven't voted to close yet, but it looks to me as if this could be a duplicate of ListPlot with plotmarkers determined by point because in my answer there I show how you can define an ErrorBarFunction for ErrorListPlot, which is what this question seems to need, too. The question doesn't have enough info to merit more effort at this point. Maybe you could be more specific to avoid having the question closed. $\endgroup$
    – Jens
    Commented Jun 24, 2018 at 18:03
  • $\begingroup$ Thanks for accepting the answer, that is one of the things to do after your question is answered. But, it's a good idea to wait and stay vigilant for some time. Better approaches may come later improving over previous replies. Experienced users may point alternatives, caveats or limitations. New users should test answers before voting and wait 24 hours before accepting the best one. Participation is essential for the site, please do your part. $\endgroup$
    – rhermans
    Commented Jun 24, 2018 at 18:11
  • 1
    $\begingroup$ @rhermans : Yes, I should have waited before accepting, but I felt like it is a trivial problem, so it's better to close it once it works so that people can work on other problems. $\endgroup$
    – Jaswin
    Commented Jun 24, 2018 at 18:39

1 Answer 1

4
$\begingroup$

data

First I create an analog to your data.

SystemOpen@SetDirectory[$TemporaryDirectory]

Export[
  "Q175948-data.txt",
  Table[
   N@{i, RandomVariate[NormalDistribution[i, Sqrt[i]]], Sqrt[i]}
   , {i, 100}],
  "TSV"
  ];

Solution

Now the answer

One can load the data using

Import["Q175948-data.txt", "TSV"]

Now you need to format it as explained in the documentation for ErrorListPlot

enter image description here

That can be done using ReplaceAll (/.) (many other ways are possible)

data /. {a_, b_, c_} -> {{a, b}, ErrorBar[c]}

Now load the ErrorBarPlots package

Needs["ErrorBarPlots`"]

Here loading formatting and plot all together

ErrorListPlot[
 Evaluate[
  Import[
    "Q175948-data.txt"
    , "TSV"
    ] /. {a_, b_, c_} -> {{a, b}, ErrorBar[c]}
  ]
 , PlotTheme -> "Scientific"
 ]
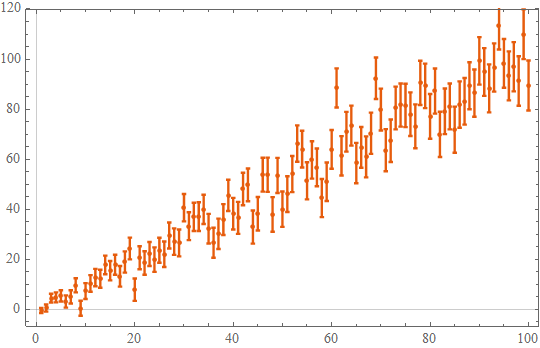
enter image description here

$\endgroup$
2
  • $\begingroup$ This works great, but I have a small doubt regarding the plotstyle, my errorbars are very less, so they seem to get covered by large dots, can I change these in some ways ? I tried the usual ListPlot commands to reduce the size of dots, but I am looking to change the color as well, so that it will look distinct. $\endgroup$
    – Jaswin
    Commented Jun 24, 2018 at 18:41
  • $\begingroup$ That may deserve another question, as moving the goalpost is usually not well received here. Beforer asking you need to be sure you need to. Start by searching in Mathematica documentation, then search this site for similar questions. Only if that it's not enough, collect all the necessary information for somebody to reproduce your problem, don't make us guess. Show explicitly what is wrong and what is that you expect, in detail. Learn about good questions here. $\endgroup$
    – rhermans
    Commented Jun 24, 2018 at 18:55

Your Answer

By clicking “Post Your Answer”, you agree to our terms of service and acknowledge you have read our privacy policy.

Not the answer you're looking for? Browse other questions tagged or ask your own question.