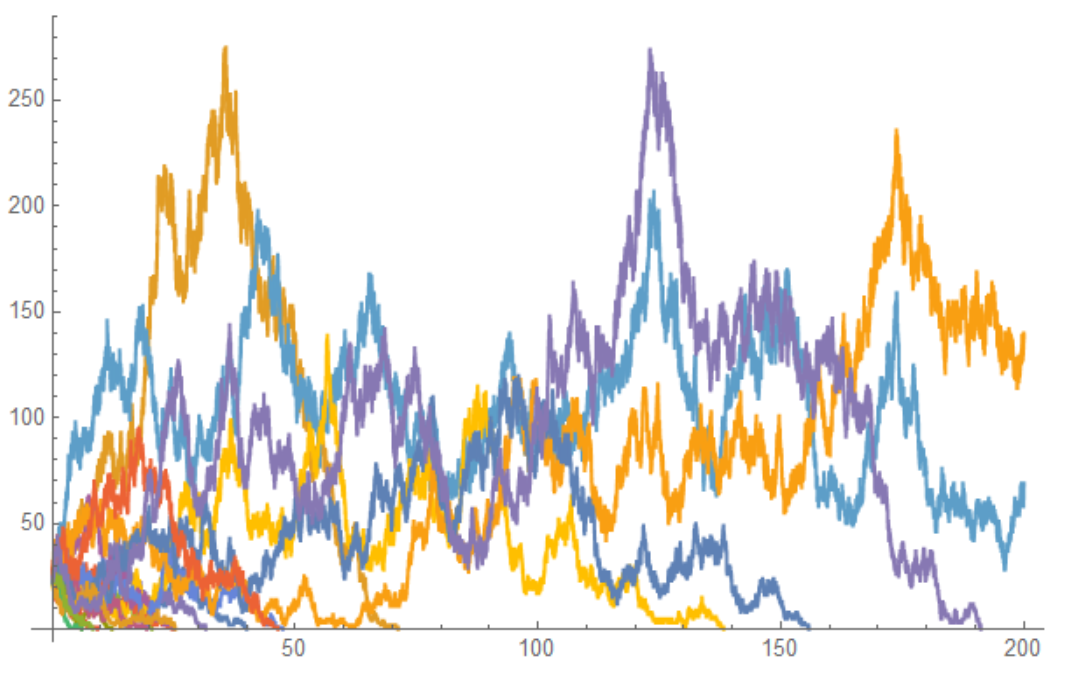
I have tried to make a functional version of the original code that incorporates the observation made in the comments by multiple discussants that n=0 breaks the original code.
This implementation uses NestWhileList to substitute for the innermost While and NestList replaces the outermost For.
Block[{test, compose},

  With[{no = 25, to = 0, te = 200, mu = 1, lam = 1, iterator = 20, seedo = 123456987},

    (* input {t, n, r}; returns 'True' is t < te (=200) and r \[NotEqual] 0 *)
    test = #1 < te && #3 != 0 &;

    (* input {t, n}; returns {t, n, r} *)
    compose = {##, (lam + mu) #2} &;

    (* get rid of the first entry in the output (= NestList's second argument (check documentation) *)
    data = Rest@NestList[

      (* create the seed to be used in BlockRandom (used for reproducibility) *)
      With[{seed = #[[1]] + 1},

        (* output = {{seed, {{t, n, r},.. }}.. } *)
        {seed, BlockRandom[

          NestWhileList[

            With[{t = #[[1]], n = #[[2]], r = #[[-1]], rands = RandomReal[{0, 1}, 2]},

              (* perhaps redundant With - helps readability *)
              With[{death = lam n},

               (* produce next {t, n, r} from {t, n} *)
               Apply[compose][{
                 t - 1/r Log[rands[[1]]],
                 Which[
                   r rands[[-1]] <= death, n - 1,
                   True, n + 1
                  ]
                }]

               ]
             ] &,

            (* init = {t, n, r} *)
            Apply[compose][{to, no}],

            (* check if t < 200 and r\[NotEqual]0 *)
            Apply[test][#] &], RandomSeeding -> #[[1]]]}

     (* init NestList *)
     ] &, {seedo, {}}, iterator];

  ]

 ]

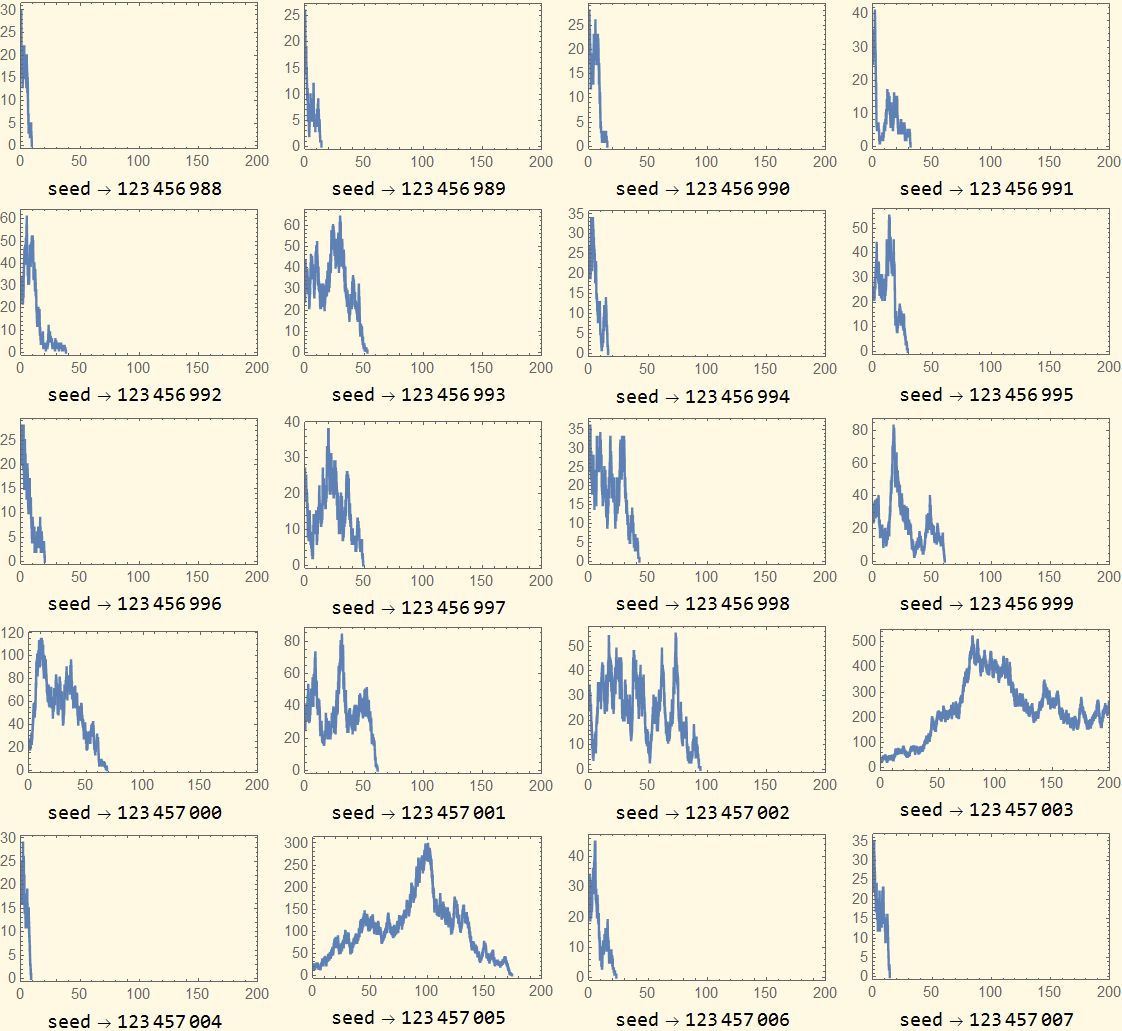
The plots were produced with:
ListLinePlot[
  Part[#, -1, All, {1, 2}],
  Frame -> True,
  PlotLegends -> Placed[Row[{HoldForm[seed] -> Part[#, 1]}], Bottom],
  InterpolationOrder -> 0,
  PlotRange -> {{0, 200}, Automatic}
 ] & /@ data // Partition[#, 4, 4, {1, 1}, {}] & // Grid


rateto be zero, you have to haven = 0, right? So you need to change yourWhichstatement so thatndoes not become zero. $\endgroup$If[Abs[rate]<100. $MachineEpsilon,Break[]]before the point of division. $\endgroup$