0
$\begingroup$

how plot this region $S=[1,2] \times[0, \dfrac{\pi}{2}] \times[0, \dfrac{\pi}{2}]$ in spherical coordinates?

Under the commands command,

{{ParametricPlot3D[FromSphericalCoordinates[{{{1,[{0, Pi},p/(2 Pi)], p}, {[Placeholder]}}}] // Evaluate, {p, 0, 2 Pi}]},{}}

but without success

$\endgroup$
3
  • 2
    $\begingroup$ This is basically one octant of a spherical shell, no? $\endgroup$ Commented Apr 2, 2018 at 11:31
  • $\begingroup$ I believe so. But as I'm starting to use mathematica now, I'm curious to try to plot the regions, and I could not $\endgroup$
    – Ilovemath
    Commented Apr 2, 2018 at 11:59
  • $\begingroup$ If all you want is that spherical shell section, there are much easier methods. For the general case: maybe try ParametricRegion[]? $\endgroup$ Commented Apr 2, 2018 at 12:49

2 Answers 2

3
$\begingroup$

For Mathematica 10 or later, the built-in function TransformedRegion sketches the image of a region under a 2D or 3D transformation. For simplicity, let me just write $r, t, p$ for the spherical coordinates $\rho, \theta, \phi$. We want to sketch the image of the region $$S=\{(r,t,p):1\le r\le 2,\ 0\le t\le\pi/2,\ 0\le p\le\pi/2\}$$ under the transformation $$x=r\sin p\cos t, z=r\sin p\sin t, y=r\cos p.$$ In Mathematica:

S = ImplicitRegion[1<=r<=2&&0 <= t <= Pi/2 && 0 <= p <= Pi/2, {r, t, p}];
f[r_, t_, p_] := {r Sin[p] Cos[t], r Sin[p] Sin[t], r Cos[p]};
R = TransformedRegion[S, f];
Region[R, Axes -> True, AxesLabel -> {x, y, z}]
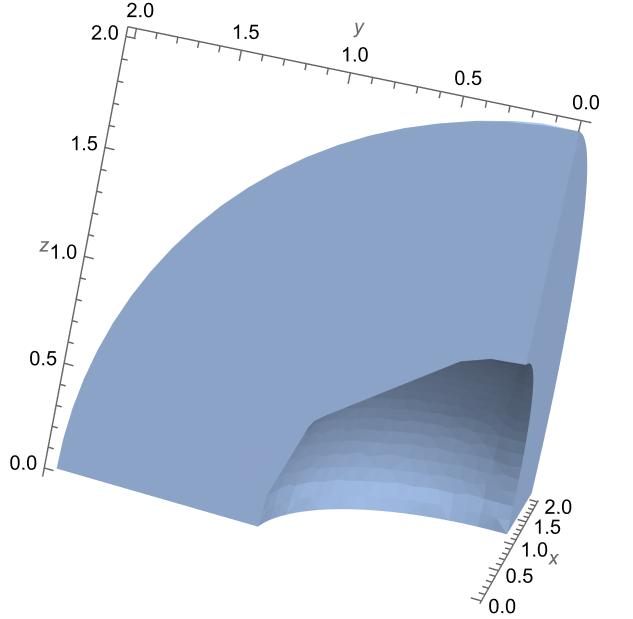
enter image description here

$\endgroup$
3
  • $\begingroup$ Usually it's $x=r\sin\theta\cos\phi$, $y=r\sin\theta\sin\phi$, $z=r\cos\theta$. $\endgroup$
    – Roman
    Commented Jun 4, 2022 at 19:36
  • $\begingroup$ Although I agree with @Roman, you code looks fine to me and certainly is original. The plot looks strange, however. $\endgroup$
    – bbgodfrey
    Commented Jun 4, 2022 at 19:47
  • $\begingroup$ The equivalent R = ParametricRegion[{{Cos[t] r Sin[p], r Sin[t] Sin[p], Cos[p] r}, 1 <= r <= 2 && 0 <= t <= Pi/2 && 0 <= p <= Pi/2}, {r, t, p}] is simpler. $\endgroup$
    – bbgodfrey
    Commented Jun 4, 2022 at 20:16
3
$\begingroup$

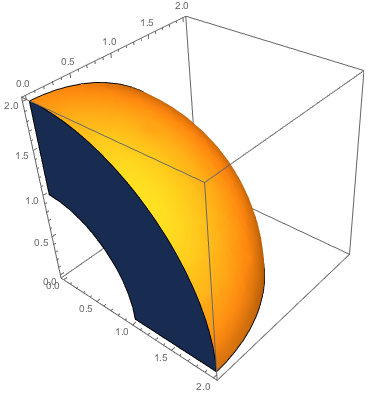
Well, in this case it is very easy. No need to use ParametricPlot3D, as RegionPlot3D can do the job:

RegionPlot3D[1 < x^2 + y^2 + z^2 < 2^2, {x, 0, 2}, {y, 0, 2}, {z, 0, 2}, 
Mesh -> None]

enter image description here

$\endgroup$

Your Answer

By clicking “Post Your Answer”, you agree to our terms of service and acknowledge you have read our privacy policy.

Not the answer you're looking for? Browse other questions tagged or ask your own question.