2
$\begingroup$

I'm having trouble with RevolutionPlot3D with two variables.

I have this parabola

 ContourPlot[0 == y^2 + x + y + 5, {x, -15, 5}, {y, -10, 10}, AxesLabel -> {x, y, z}]

but when I try to do RevolutionPlot3D with the equation

RevolutionPlot3D[{(y^2 + y + x + 5)}, {y, -5, 5}, {x, -5, 5}, 
                RevolutionAxis -> {1, 0, 0}, PlotRange -> All, AxesLabel -> {x, y, z}]

it won't work, because x should be an Theta. How can I have something similar to

RevolutionPlot3D[{(y^2 + y + 5)}, {y, -5, 5}, {\[Theta], 0, 2 \[Pi]}, 
                 RevolutionAxis -> {1, 0, 0}, PlotRange -> All, AxesLabel -> {x, y, z}]

with a second variable?

$\endgroup$
1
  • $\begingroup$ Because it's not the same parabola, you could have one with a x*y term. Or an hyperbola, with both x^2 and y^2. $\endgroup$
    – RNB
    Commented Dec 13, 2012 at 1:58

2 Answers 2

6
$\begingroup$

Sometimes you cannot solve for $x$ in terms of $y$ or vice versa: what to do then? One approach is to exploit NDSolve by turning your (implicit) equation into a differential equation. The solution will give $x$ and $y$ in terms of a parameter, which is what RevolutionPlot prefers. This requires an additional equation: I use one that parameterizes the curve by arclength, to make the interpretation of the parameter especially easy.

(The example in the question doesn't need this treatment--but it does require you to recognize that $x$ should be solved for $y$ instead of the other way around. In general neither variable will serve as a parameter: the solution becomes "multiple valued.")

Cubics already get complicated enough, so here to illustrate the procedure, and show how mechanical it is, is a manipulation of a generic cubic curve, rotated around the vertical axis. The equation of the curve is implicitly given by the function f (controlled via two manipulated parameters b and c). The code converts this into a differential equation (using D), solves it for a specified starting point $(x_0, y_0)$, and displays the revolution plot for a $100$ unit section of the curve centered at the starting point (with color representing the parameter itself). Enjoy!

Manipulate[Block[{f, x, y, u, v, t},
  f[x_, y_] := x y^2 - x^3 - b x^2 y + c y^3;
  {u, v} = {x, y} /. NDSolve[{D[f[x[t], y[t]], t] == 0, 
      x'[t]^2 + y'[t]^2 == 1, y[0] == y0, x[0] == x0}, {x, y}, {t, -50, 50}];
  RevolutionPlot3D[Evaluate @ Through[u[t]], {t, -50, 50}, 
      ColorFunction -> (ColorData["Rainbow"][#4] &), PlotStyle -> Opacity[0.9]]
  ],
 {b, -10, 10}, {c, -10, 10}, {x0, -20, 20}, {y0, -20, 20}
 ]
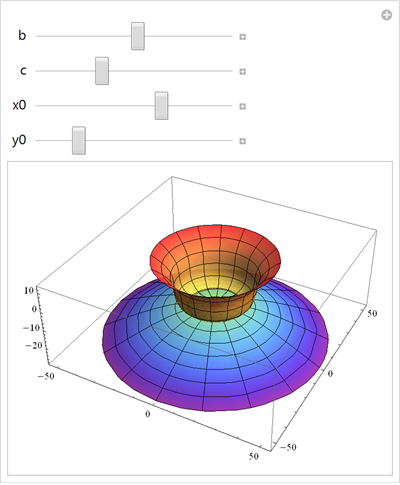
Revolution plot

$\endgroup$
6
  • $\begingroup$ I understand the approach and it does seem to be more efficient, but I'm not quite sure how derivate the function the way you did if it gets more complex. For instance, 0==1/2 + x^2/2 + y^2/2 - x^2 Cos[(13 \[Pi])/64]^2 - 2 x Cos[(13 \[Pi])/64] Sin[(13 \[Pi])/64] - Sin[(13 \[Pi])/64]^2 is a simple hyperbola equation (which is what I'm working with right now). I can deriviate the equation by myself, but I don't understand how to do it the way you did. $\endgroup$
    – RNB
    Commented Dec 13, 2012 at 23:16
  • 2
    $\begingroup$ It's incredibly simple: paste your expression (without the initial 0==) in place of that to the right of := in the definition of f and you're all set. $\endgroup$
    – whuber
    Commented Dec 13, 2012 at 23:29
  • $\begingroup$ I know this is a shot in the dark, but given the recent downvote, I would be grateful to learn what could be done to improve this answer. Are there limitations worth pointing out? (Probably.) Is the exposition unclear at any point? Is there a superior alternative? $\endgroup$
    – whuber
    Commented Dec 14, 2012 at 19:14
  • 1
    $\begingroup$ It gave me exactly what I wanted, so I don't see why it had been downvoted (I should have answered to the answer you gave, I'm sorry). As I am far from understanding Mathematica, I cannot see a better alternative. $\endgroup$
    – RNB
    Commented Dec 14, 2012 at 19:35
  • $\begingroup$ Nothing to be sorry about, Renaud. An upvote had been reversed, which made me concerned that someone had tested out this solution, found it wanting, and then downvoted it out of frustration. It turns out to have a more mundane explanation: that user has now been removed from SE, suggesting that their actions overall might have been found to be inconsistent with norms of reasonable behavior. $\endgroup$
    – whuber
    Commented Dec 14, 2012 at 20:30
5
$\begingroup$

You need to have your parabola in parametric form. From you implicit equation we could just solve for $x$ in terms of $y$:

Solve[0 == y^2 + x + y + 5, x]
(* {{x -> -5 - y - y^2}} *)

(Hopefully you could have actually done that in your head). And then we can just use $y$ as the parameter:

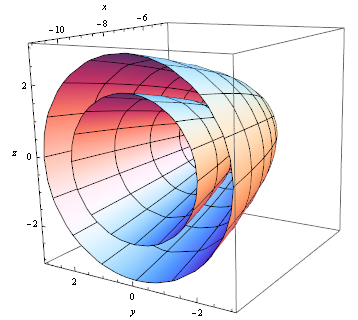
RevolutionPlot3D[{-5 - y - y^2, y}, {y, -3, 2}, {\[Theta], 0, 2 \[Pi]},
  RevolutionAxis -> {1, 0, 0}, PlotRange -> All, AxesLabel -> {x, y, z}]

one parameter two cups

$\endgroup$
1
  • $\begingroup$ Thanks, it does work! Except for the y after the equation, it's just what I was looking for. And I'll keep in mind how to solve the equation, it might get complicated later on... $\endgroup$
    – RNB
    Commented Dec 13, 2012 at 3:28

Your Answer

By clicking “Post Your Answer”, you agree to our terms of service and acknowledge you have read our privacy policy.

Not the answer you're looking for? Browse other questions tagged or ask your own question.