4
$\begingroup$

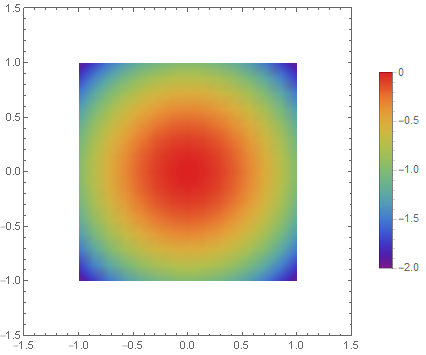
I have e.g. the following DensityPlot, where the PlotRange exceeds the internal DataRange:

DensityPlot[{-x^2 - y^2, -x^2 - y^2}, {x, -1, 1}, {y, -1, 1}, ColorFunction -> "Rainbow", 
 PlotLegends -> Automatic, PlotRange -> {{-1.5, 1.5}, {-1.5, 1.5}}]

enter image description here

How can I fill the white frame around the density plot with the color corresponding to lowest legend value (here -2)? It can be any color scheme.

$\endgroup$

2 Answers 2

2
$\begingroup$

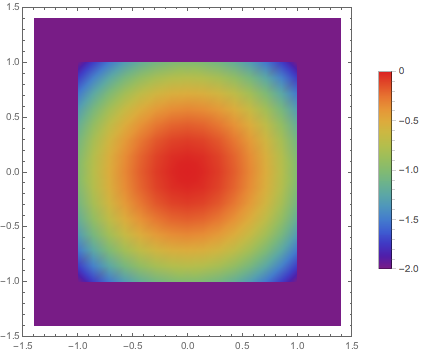
You can also use options epilog and prolog to combine two Graphics objects:

DensityPlot[{-x^2 - y^2, -x^2 - y^2}, {x, -1, 1}, {y, -1, 1}, 
ColorFunction -> "Rainbow", PlotLegends -> Automatic, Frame -> True,
PlotRange -> {{-1.5, 1.5},{-1.5, 1.5}},
Prolog -> {{ColorData["Rainbow"]@0,Rectangle[{-1.4, -1.4}, {1.4, 1.4}]}}]

Density plot

$\endgroup$
2
2
$\begingroup$

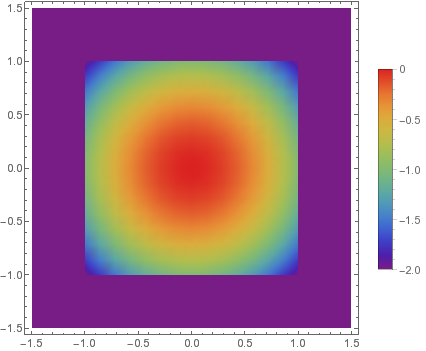
You can combine two DensityPlots

xymin = -2;
Show[DensityPlot[xymin, {x, -1.5, 1.5}, {y, -1.5, 1.5}, ColorFunction -> "Rainbow"],
     DensityPlot[-x^2 - y^2, {x, -1, 1}, {y, -1, 1}, ColorFunction -> "Rainbow",
                 PlotLegends -> Automatic, PlotRange -> {{-1.5, 1.5}, {-1.5, 1.5}}]]

enter image description here

$\endgroup$

Your Answer

By clicking “Post Your Answer”, you agree to our terms of service and acknowledge you have read our privacy policy.

Not the answer you're looking for? Browse other questions tagged or ask your own question.