20
$\begingroup$

I want to simulate a diffusive process in a 2D grid, for a central initial value of 1 to the adjacent cells initially at 0.

At each time step, the value of the +1 level adjacent cells are increased by a definite value (normalized to be maximum 1). I chose a decreasing exponential function but other types of functions could fit.

t=0

00000
00000
00100
00000
00000

t=1

00000
0xxx0
0x1x0
0xxx0
00000

t=2

yyyyy
yzzzy
yz1zy
yzzzy
yyyyy

etc.

I looked for other related questions but couldn't find any similar except for this one, which is a bit different though: Can you apply the Cellular Automata function to a grid containing numbers?

For now I'm struggling with For loops and counters but I'm not satisfied with my solution.

Thank you in advance for your tips.

$\endgroup$
2
  • 3
    $\begingroup$ You can use ListConvolve to do convolution of your 2D grid with a diffusion kernel to simulate a single time step. $\endgroup$ Commented Nov 14, 2017 at 13:44
  • 2
    $\begingroup$ I recommend the books "Modeling Nature" by Gaylord and Nishidate, as well as "Computer Simulations with Mathematica" by Gaylord and Wellin. $\endgroup$ Commented Nov 14, 2017 at 16:02

2 Answers 2

24
+100
$\begingroup$

You can use ListConvolve to simulate a single diffusion time step and build a simulation out of that. I'll show a simple example: Let's say we start with simple initial conditions like in your example

(initialconditions = Normal@SparseArray[{{3, 3} -> 1}, {5, 5}]) // MatrixForm

initial conditions

and a diffusion kernel

kernel = {
  {1/120, 1/60, 1/120},
  {1/60, 9/10, 1/60},
  {1/120, 1/60, 1/120}
};

Then we can define a function that simulates a single time step as

Step = ListConvolve[kernel, #, 2, 0] &;

Here the 2 aligns with the center of our kernel to make sure the simulation doesn't drift. The 0 is for padding outside our kernel, otherwise we would get cyclic convolution which we don't want in this case.

Now we can simulate multiple time steps via NestList:

solution = NestList[Step, initialconditions, 30];

and plot the solution as an animation:

ListAnimate[ListPlot3D[#, PlotRange -> {0, 1}, MeshFunctions -> {#3 &}] & /@ solution]
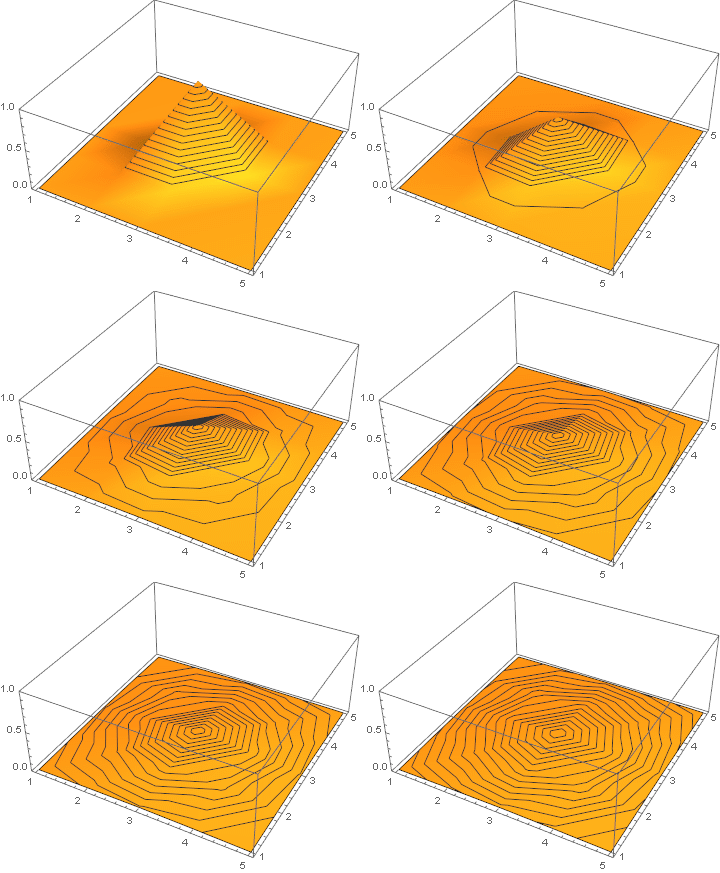
animated diffusion plot

Realistic thermal diffusion example

We can do a more realistic example to show how we could actually use this to simulate a real physical scenario.

We'll start with the heat equation

heateq = dudt - \[Alpha] laplaceu == 0

where u is the temperature, $\alpha$ is the thermal diffusivity, dudt is the change of temperature over time, and laplaceu is the curvature of the temperature, i.e. the total of the second derivatives of u with respect to our spatial dimensions x and y.

Let's discretize our heat equation in time by replacing our time derivative by a finite difference

heateq /. {dudt -> \[CapitalDelta]u/\[CapitalDelta]t}

now, we can solve this for $\Delta u$ to know what our next u after one timestep should be

nextu = u + \[CapitalDelta]u /. First@Solve[%, \[CapitalDelta]u]

u + laplaceu $\alpha$ $\Delta$t

The next step is to discretize our heat equation in space, too. We do this by approximating our spatial derivatives by finite difference approximations, which requires the value of the immediate neighbours for every grid cell for which a 3x3 kernel is sufficient. The kernel can be constructed like this:

(diffusionkernel = nextu /. {u -> ( {
    {0, 0, 0},
    {0, 1, 0},
    {0, 0, 0}
   } ), laplaceu -> (1/\[CapitalDelta]x^2 ( {
       {0, 0, 0},
       {1, -2, 1},
       {0, 0, 0}
      } ) + 1/\[CapitalDelta]y^2 ( {
       {0, 1, 0},
       {0, -2, 0},
       {0, 1, 0}
      } ))}) // MatrixForm

Inputting the diffusion kernel

Diffusion kernel matrix

and now we have a nice general diffusion kernel where we can plug in physical values for the width and height of our grid cells, the thermal diffusivity of our material and the amount of time one simulated time step represents.

For this example let's go with 1mm x 1mm grid cells and a time step of 1ms and Gold, which has a thermal diffusivity of $1.27\cdot10^{-4} m^2/s$

kernel = diffusionkernel /. {
             \[Alpha] -> 1.27*10^-4(*thermal diffusivity of gold*),
             \[CapitalDelta]x -> 1/1000(*1mm*),
             \[CapitalDelta]y -> 1/1000(*1mm*), 
             \[CapitalDelta]t -> 1/1000(*1ms*)
         }

Specific diffusion kernel with numeric values

We define our diffusion step as before

DiffusionStep = ListConvolve[kernel, #, 2, 0] &

and choose a grid dimension to represent 1cm x 1cm

n = 11;(* set the dimensions of our simulation grid *)

We need some initial conditions

(initialconditions = Array[20 &, {n, n}]) // MatrixForm

representing constant room temperature of 20 degrees. Also we need some interesting boundary conditions. Let's say we choose to heat the left half of the border of our gold bar to a constant 100 degrees and the right side we cool to have constant 0 degrees:

(bcmask = Array[Boole[#1 == 1 \[Or] #1 == n \[Or] #2 == 1 \[Or] #2 == n] &, {n, n}]) // MatrixForm
(bcvalues = Array[If[#2 <= n/2, 100, 0] &, {n, n}]) // MatrixForm
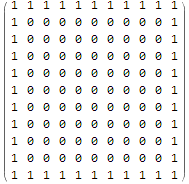
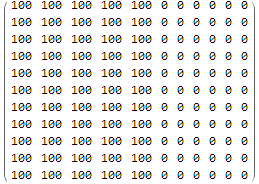
boundary condition maskboundary condition values

Here we encoded the boundary conditions as a binary mask, which specifies if the grid cell is a boundary cell and a matrix which contains the values the boundary cells should have.

We can now write a step which enforces our boundary condition:

EnforceBoundaryConditions = bcmask*bcvalues + (1 - bcmask) # &;

E.g. applied to our initial conditions it looks like this

EnforceBoundaryConditions[initialconditions] // MatrixForm
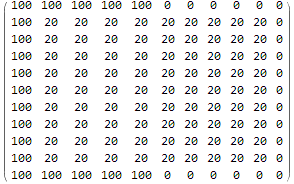
example of our applied boundary conditions

Now that we have everything together we can start our simulation of our partly heated/partly cooled infinite 1cm x 1cm gold bar!

solution = NestList[
               Composition[EnforceBoundaryConditions, DiffusionStep], 
               initialconditions,
               30
          ];

and visualize the result:

anim = ListPlot3D[#2,
           PlotRange -> {0, 100}, MeshFunctions -> {#3 &}, 
           AxesLabel -> {"x/mm", "y/mm", "T/\[Degree]C"}, 
           PlotLabel -> "Temperature distribution after " <> ToString[#1] <> " ms", 
           DataRange -> {{0, n - 1}, {0, n - 1}}
       ] & @@@ Transpose[{Range[Length[#]] - 1, #} &@solution];
ListAnimate[anim]
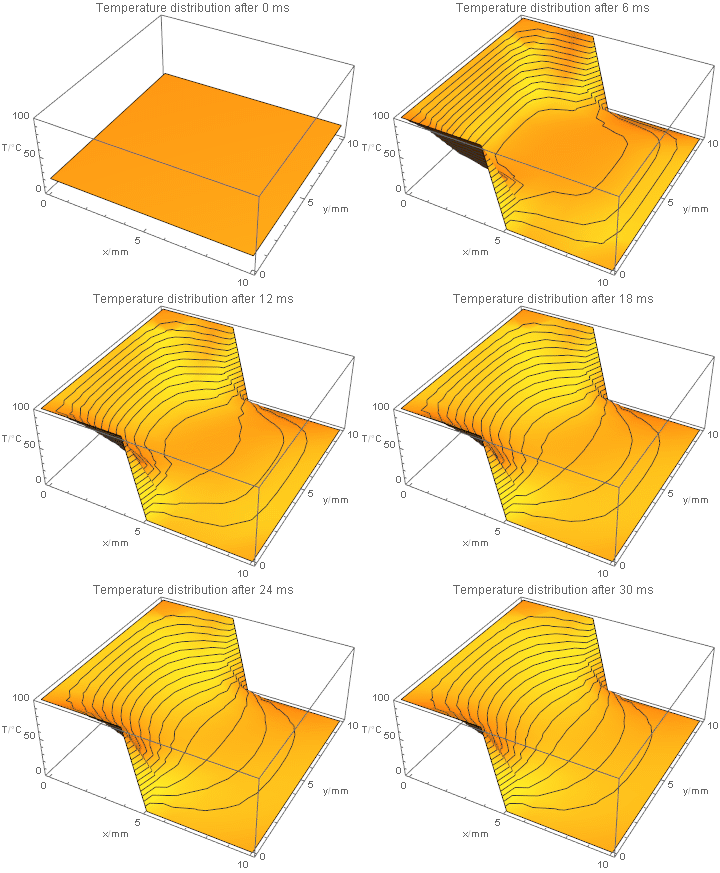
Gold heat diffusion sim with boundary conditions.

This was actually fun working on, thanks to @J.M. for the suggestion!

$\endgroup$
10
  • $\begingroup$ That animation is mesmerizing. I'm not an expert, so: where did kernel come from? $\endgroup$ Commented Nov 14, 2017 at 14:10
  • 1
    $\begingroup$ Thanks! To be honest i just made it up :) the most important thing is that it's symmetric, and if you want energy (heat/mass/etc) conservation the components should add up to 1. For something physically accurate it's probably a good idea to discretize a kernel like this by integrating it for individual grid cells and using that. $\endgroup$ Commented Nov 14, 2017 at 14:22
  • $\begingroup$ Another way would be discretizing the differential operator itself (in this case the laplace operator), as seen here and using it in the original heat equation to get a time step update recipe for our grid. $\endgroup$ Commented Nov 14, 2017 at 14:22
  • 1
    $\begingroup$ Also for reference, a great source for getting a more in depth look at these kinds of hands on engineering examples is the book 'Partial Differential Equations for Scientists and Engineers' by Stanley Farlow, published by Dover. Can highly recommend that book. $\endgroup$ Commented Nov 15, 2017 at 14:20
  • 1
    $\begingroup$ Thank you for the answer. I finally did it with traditional programming tools but this helps a lot to have a second Mathematica optimized code. $\endgroup$
    – Valacar
    Commented Nov 15, 2017 at 14:36
1
$\begingroup$

My personal answer:

There is my personal (traditional programming style) interpretation of my problem.

Let's say we have a grid of 50*50, with 1 representing a possibility of occupation and 0 an impossibility (ex: water in a valley with hills, where it can't go).

x0 = 50;
y0 = 50;
Table[Table[tab0[i, j] = 1, {j, 1, y0}], {i, 1, x0}];

I created two variables with the same size of the grid, one representing the concentration (Cpop) and the other a counter (compteur).

Clear[Cpop, compteur]
MatrixForm[Table[Table[Cpop[i, j][0] = 0, {j, 1, y0}], {i, 1, x0}]];
MatrixForm[Table[Table[compteur[i, j][0] = 1, {j, 1, y0}], {i, 1, x0}]];
Cpop[Round[x0/2], Round[y0/2]][0] = 1;
compteur[Round[x0/2], Round[y0/2]][0] = 3;

The idea is that at the beginning we have a drop at the center of the grid, which diffuses following a concentration function conc[t] (no matter its form). The counter has 3 values: 1, 2 or 3. Then I coded multiple conditions with changing counter values. If the counter is 3 I skip it, etc.

For[t = 1, t < 50, t++,
 For[i = 1, i <= x0, i++,
  For[j = 1, j <= y0, j++,
Cpop[i, j][t] = Cpop[i, j][t - 1];
compteur[i, j][t] = compteur[i, j][t - 1]
 ]
];

For[i = 1, i <= x0, i++,
 For[j = 1, j <= y0, j++,
  If[Cpop[i, j][t] > 0 && compteur[i, j][t] == 3,
   If[compteur[i - 1, j - 1][t] != 3, 
 Cpop[i - 1, j - 1][t] = 
  conc[t] Cpop[Round[x0/2], Round[y0/2]][0] ; 
 compteur[i - 1, j - 1][t] = 2];
   If[compteur[i - 1, j][t] != 3, 
 Cpop[i - 1, j][t] = conc[t] Cpop[Round[x0/2], Round[y0/2]][0]; 
 compteur[i - 1, j][t] = 2];
   If[compteur[i - 1, j + 1][t] != 3, 
 Cpop[i - 1, j + 1][t] = 
  conc[t] Cpop[Round[x0/2], Round[y0/2]][0] ; 
 compteur[i - 1, j + 1][t] = 2];
   If[compteur[i, j - 1][t] != 3, 
 Cpop[i, j - 1][t] = conc[t] Cpop[Round[x0/2], Round[y0/2]][0] ; 
 compteur[i, j - 1][t] = 2];
   If[compteur[i + 1, j - 1][t] != 3, 
 Cpop[i + 1, j - 1][t] = 
  conc[t] Cpop[Round[x0/2], Round[y0/2]][0] ; 
 compteur[i + 1, j - 1][t] = 2];
   If[compteur[i + 1, j][t] != 3, 
 Cpop[i + 1, j][t] = conc[t] Cpop[Round[x0/2], Round[y0/2]][0] ; 
 compteur[i + 1, j][t] = 2];
   If[compteur[i + 1, j + 1][t] != 3, 
 Cpop[i + 1, j + 1][t] = 
  conc[t] Cpop[Round[x0/2], Round[y0/2]][0]; 
 compteur[i + 1, j + 1][t] = 2];
   If[compteur[i, j + 1][t] != 3, 
 Cpop[i, j + 1][t] = conc[t] Cpop[Round[x0/2], Round[y0/2]][0]; 
 compteur[i, j + 1][t] = 2];
Cpop[i, j][t] += conc[t] Cpop[Round[x0/2], Round[y0/2]][0];
  ]
 ]
];

For[i = 1, i <= x0, i++,
 For[j = 1, j <= y0, j++,
 Cpop[i, j][t] = Cpop[i, j][t] tab0[i, j];
 If[compteur[i, j][t] == 2,
  compteur[i, j][t] = 3
  ]
 ]
];

Cpop[Round[x0/2], Round[y0/2]][t] = 1;
]

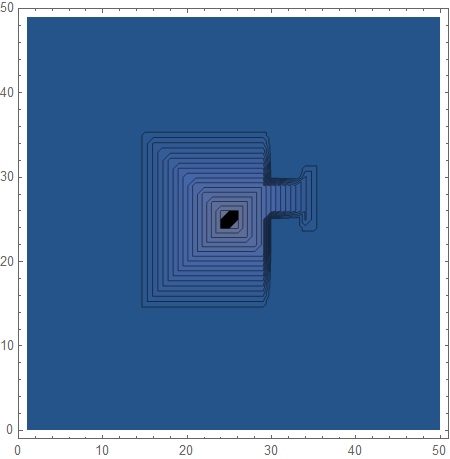
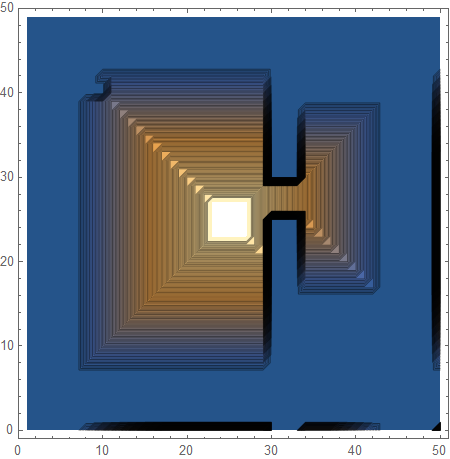
With that code (not that elegant though), I managed to observe interesting phenomena. For example, let's imagine a grid with an obstacle (like a river crossed by a bridge).

After 10 iterations

After ~15 iterations

$\endgroup$

Your Answer

By clicking “Post Your Answer”, you agree to our terms of service and acknowledge you have read our privacy policy.

Not the answer you're looking for? Browse other questions tagged or ask your own question.