1
$\begingroup$

I am trying to graph various vectors of a $3\times3$ matrix to make a box by writing a function that takes in a $3\times3$ matrix and then plots the polygons created from it. Let the 3 column vectors be $\vec{A}$, $\vec{B}$, and $\vec{C}$, then for example one face of the box is given by the polygon

P1 = Polygon[O, A, A + B, B]

where O is the origin. There are 5 additional polygons that make up the surface of the box; however, I can't figure out how to set up function correctly. Here is my code so far:

plotBox[{ {a_, b_, c_}, {d_, e_, f_ }, {g_, h_, i_} }] := 
P1 = Polygon[{{0, 0, 0}, {a, d, g}, {a + b, d + e, g + h}, {b, e, 
h}}]    
Graphics3D[{P1}]

Now if I call plotBox and pass it a $3\times3$ matrix, it will simply output the Polygon that was created. However, if I go to where I actually wrote the function and hit Shift+Enter, then it will Graphics3D the plotBox I entered in. What exactly am I doing wrong here?

$\endgroup$

2 Answers 2

2
$\begingroup$

The main problem with your code was that you got P1 in there with your function definition.

plotBox[{{a_, b_, c_}, {d_, e_, f_}, {g_, h_, i_}}] := 
  Polygon[{{0, 0, 0}, {a, d, g}, {a + b, d + e, g + h}, {b, e, h}}]

will work to get you one of the polygons.

For a more general function to get all six polygons, you can do

plotbox[matrix_] := With[{trmat = Transpose @ matrix}, 
  Polygon /@ 
   Transpose[
    {#, Total @ trmat - #} & /@ {{0, 0, 0}, #1, #1 + #2, #2}
   ] & @@@ Subsets[trmat, {2}]
 ]

Then

m = RandomReal[1, {3, 3}];
p1 = plotbox[m];
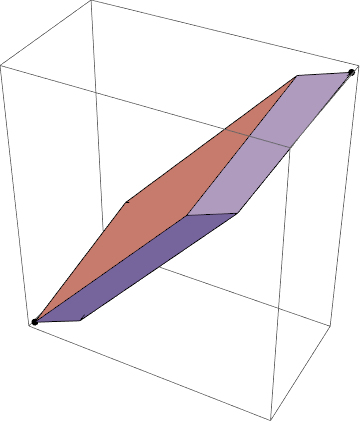
Graphics3D[{PointSize[Large], Point[{{0, 0, 0}, Total @ Transpose @ m}], p1}]

enter image description here

A brief explanation

plotbox might not be particularly intuitive to read, but it actually breaks down quite simply. First, suppose that our matrix is

matrix = {{a, b, c}, {d, e, f}, {g, h, i}};

Then trmat = Transpose @ matrix just gives a list of the column vectors (if you want to plot the row vector box, just leave out the Transpose), and

Subsets[trmat, {2}]

(* { {{a, d, g}, {b, e, h}}, 
     {{a, d, g}, {c, f, i}}, 
     {{b, e, h}, {c, f, i}} } *)

gives all the vector pairs. Each pair is used to construct two polygons. The vertices for one polygon from the first pair are

{{0, 0, 0}, {a, d, g}, {a + b, d + e, g + h}, {b, e, h}}

(as in the OP's original function). The second set of vertices are these same points subtracted from the total of all the column vectors of matrix:

Total @ trmat (* or Total /@ matrix *)

(* {a + b + c, d + e + f, g + h + i} *)

Then plotbox sets up the pure function

Transpose[{#, Total @ trmat - #} & /@ {{0, 0, 0}, #1, #1 + #2, #2}] &

which, when applied to a pair of points in Subsets[trmat, {2}] (corresponding to the slots #1 and #2), gives the vertices of the two polygons derived from that pair. The @@@ simply Applys the function to each pair, giving a list of polygon vertices. Polygon /@ then turns these vertices into actual polygons.

$\endgroup$
1
  • 1
    $\begingroup$ Here's another possible implementation: plotbox[matrix_?MatrixQ] := With[{trmat = Transpose[matrix]}, Polygon /@ Flatten[Transpose[{#, 1 - #} & /@ {{0, 0, 0}, #1, #1 + #2, #2}].trmat & @@@ Subsets[IdentityMatrix[3], {2}], 1]] $\endgroup$ Commented Nov 1, 2017 at 13:42
1
$\begingroup$

If a visualization is all that's wanted, use Parallelepiped[]:

BlockRandom[SeedRandom[128]; (* for reproducibility *)
            Graphics3D[Parallelepiped[{0, 0, 0}, Transpose[RandomReal[1, {3, 3}]]]]]

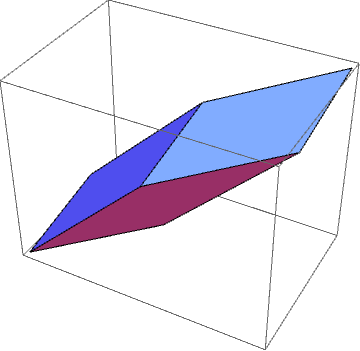
random parallelepiped

(Compare with the result of Graphics3D[plotbox[RandomReal[1, {3, 3}]]] as in aardvark's answer.)

If you really need the polygons, you can start with PolyhedronData["Cube"] instead:

BlockRandom[SeedRandom[128]; 
            MapAt[(# + 1/2).Transpose[RandomReal[1, {3, 3}]] &, 
                  PolyhedronData["Cube", "GraphicsComplex"], {1}] // Normal]
   {{Polygon[{{1.65941, 1.11438, 1.2699}, {0.872272, 0.730417, 1.00725},
              {0.0192757, 0.71586, 0.166596}, {0.80641, 1.09982, 0.429248}}], 
     Polygon[{{1.65941, 1.11438, 1.2699}, {0.80641, 1.09982, 0.429248},
              {0.787135, 0.383961, 0.262652}, {1.64013, 0.398517, 1.1033}}], 
     Polygon[{{1.65941, 1.11438, 1.2699}, {1.64013, 0.398517, 1.1033},
              {0.852996, 0.0145563, 0.840653}, {0.872272, 0.730417, 1.00725}}], 
     Polygon[{{0.872272, 0.730417, 1.00725}, {0.852996, 0.0145563, 0.840653},
              {0., 0., 0.}, {0.0192757, 0.71586, 0.166596}}], 
     Polygon[{{0., 0., 0.}, {0.852996, 0.0145563, 0.840653},
              {1.64013, 0.398517, 1.1033}, {0.787135, 0.383961, 0.262652}}], 
     Polygon[{{0.0192757, 0.71586, 0.166596}, {0., 0., 0.},
              {0.787135, 0.383961, 0.262652}, {0.80641, 1.09982, 0.429248}}]}}

and then evaluating Graphics3D[%] should yield the expected picture.

$\endgroup$

Your Answer

By clicking “Post Your Answer”, you agree to our terms of service and acknowledge you have read our privacy policy.

Not the answer you're looking for? Browse other questions tagged or ask your own question.