Use the sliders to modify matrix entries. Click and drag locators (small disks) to modify initial points; ALT+Click to add/remove locators.
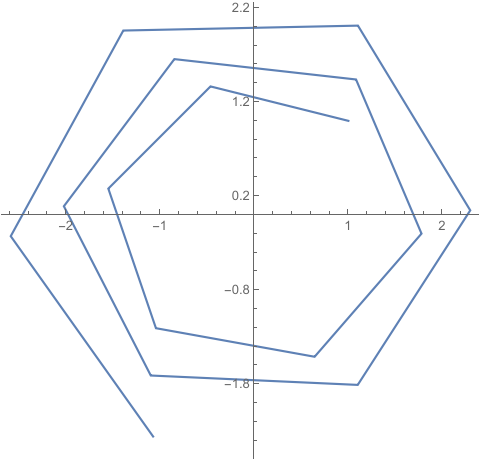
Manipulate[ListLinePlot[Transpose @ NestList[#.{{a, b}, {c, d}} &, pt, 100],
   PlotStyle -> PointSize[Medium], PlotRange -> 5 {{-1, 1}, {-1, 1}},
   BaseStyle -> Arrowheads[{0., .05, 0.}], AspectRatio -> Automatic,
   PlotLegends -> Placed[LineLegend[Defer /@ pt, LegendLabel -> "{x0,y0}",
      LegendFunction -> Panel], Right],
   Epilog -> {AbsolutePointSize[10],
        {ColorData[97]@#, Point@pt[[#]]} & /@ Range[Length[pt]]},
   ImageSize -> 400, Frame -> True] /. Line -> Arrow,
 Spacer[10], Spacer[10], Spacer[10],
 Grid[{{Item[Labeled[Control@{{a, .8, Style["a", 18]}, 0, 1, Slider,
        ImageSize -> Small}, Style[Dynamic[a], 20], Top],
     Background -> (Dynamic @ ColorData[{"Rainbow", {-1, 1}}][a])],
    Item[Labeled[Control@{{b, .0, Style["b", 18]}, -1, 1, Slider,
        ImageSize -> Small}, Style[Dynamic[b], 20], Top],
     Background -> (Dynamic @ ColorData[{"Rainbow", {-1, 1}}][b])]},
    {Item[Labeled[Control@{{c, .0, Style["c", 18]}, -1, 1, Slider,
        ImageSize -> Small}, Style[Dynamic[c], 20], Top],
     Background -> (Dynamic@ColorData[{"Rainbow", {-1, 1}}][c])],
    Item[Labeled[Control@{{d, .4, Style["d", 18]}, 0, 1, Slider,
        ImageSize -> Small}, Style[Dynamic[d], 20], Top],
     Background -> (Dynamic@ColorData[{"Rainbow", {-1, 1}}][d])]}},
  Alignment -> {Center, Center}, ItemSize -> {15, 15}, Dividers -> All],
 {{pt, 3 {{1, 1}, {-1, 1}, {1, -1}}}, Locator,
    Appearance -> None, LocatorAutoCreate -> {1, 10}},
 Alignment -> Center, ControlPlacement -> Left]
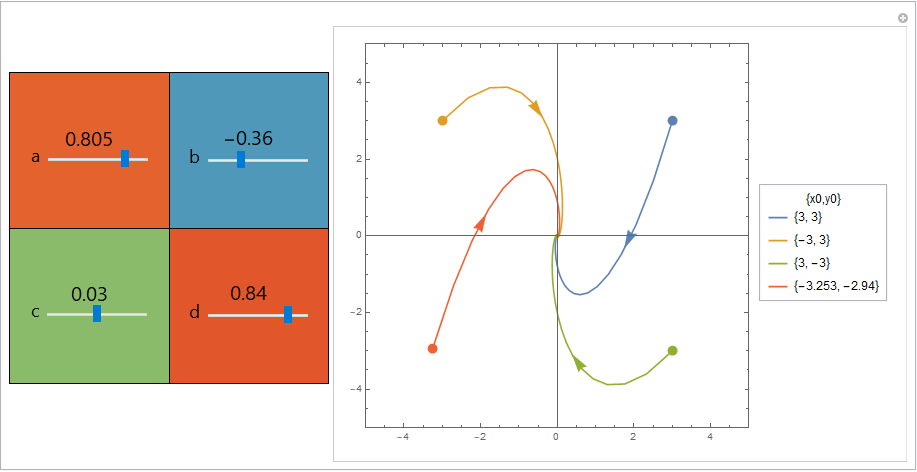
An alternative implementation using Graphics:
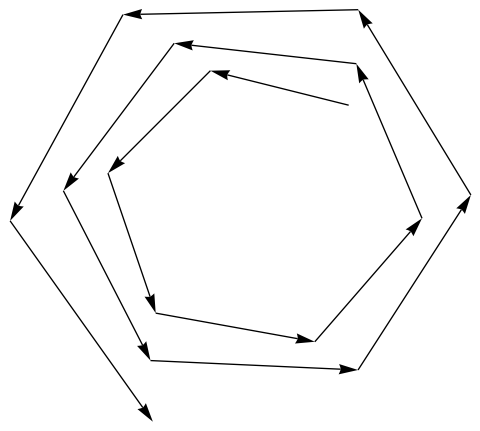
Manipulate[Legended[Graphics[{AbsolutePointSize[10], ColorData[97]@#,
    Arrowheads[.03], Point @ pt[[#]],
    Arrow[Partition[NestList[{{a, b}, {c, d}}.# &, pt[[#]], t - 1], 2, 1]]} & /@
     Range[Length[pt]],
   ImageSize -> 400, Frame -> True, Axes -> True,
   PlotRange -> 5 {{-1, 1}, {-1, 1}}],
  Placed[LineLegend[ColorData[97] /@ Range[Length @ pt], Defer /@ pt,
    LegendLabel -> "{x0,y0}", LegendFunction -> Panel], Right]],
 Spacer[10], Spacer[10], Spacer[10],
 Grid[{{Item[Labeled[Control @ {{a, .8, Style["a", 18]}, 0, 1, Slider,
        ImageSize -> Small}, Style[Dynamic[a], 20], Top],
     Background -> (Dynamic @ ColorData[{"Rainbow", {-1, 1}}][a])],
    Item[Labeled[Control @ {{b, .0, Style["b", 18]}, -1, 1, Slider,
         ImageSize -> Small}, Style[Dynamic[b], 20], Top],
       Background -> (Dynamic @ ColorData[{"Rainbow", {-1, 1}}][b])]},
    {Item[Labeled[Control @ {{c, .0, Style["c", 18]}, -1, 1, Slider,
         ImageSize -> Small}, Style[Dynamic[c], 20], Top],
       Background -> (Dynamic @ ColorData[{"Rainbow", {-1, 1}}][c])],
    Item[Labeled[Control @ {{d, .4, Style["d", 18]}, 0, 1, Slider,
         ImageSize -> Small}, Style[Dynamic[d], 20], Top],
       Background -> (Dynamic @ ColorData[{"Rainbow", {-1, 1}}][d])]}},
  Alignment -> {Center, Center}, ItemSize -> {16, 16}, Dividers -> All],
  {{pt, 3 {{1, 1}, {-1, 1}, {1, -1}}}, Locator,
     Appearance -> None, LocatorAutoCreate -> {1, 10}},
  Spacer[10],
  {{t, 1}, 1, 80, 1, Animator, AnimationRunning -> False, DisplayAllSteps -> True},
 Alignment -> Center, ControlPlacement -> Left]
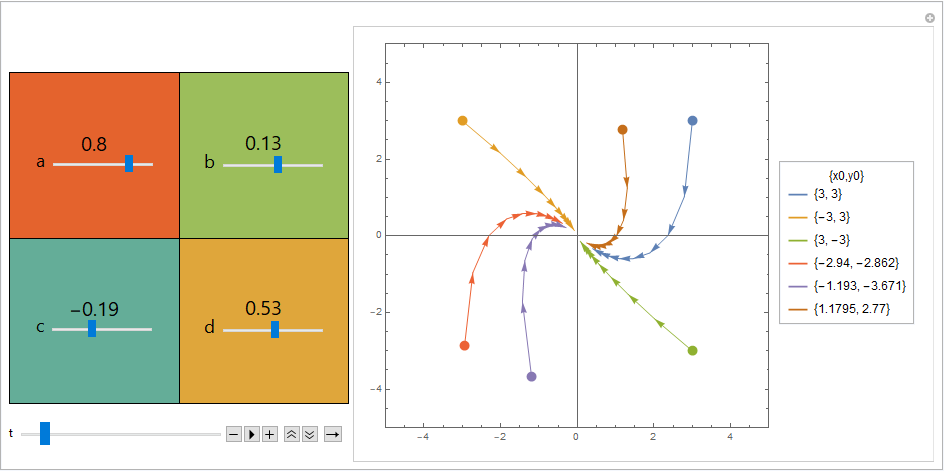
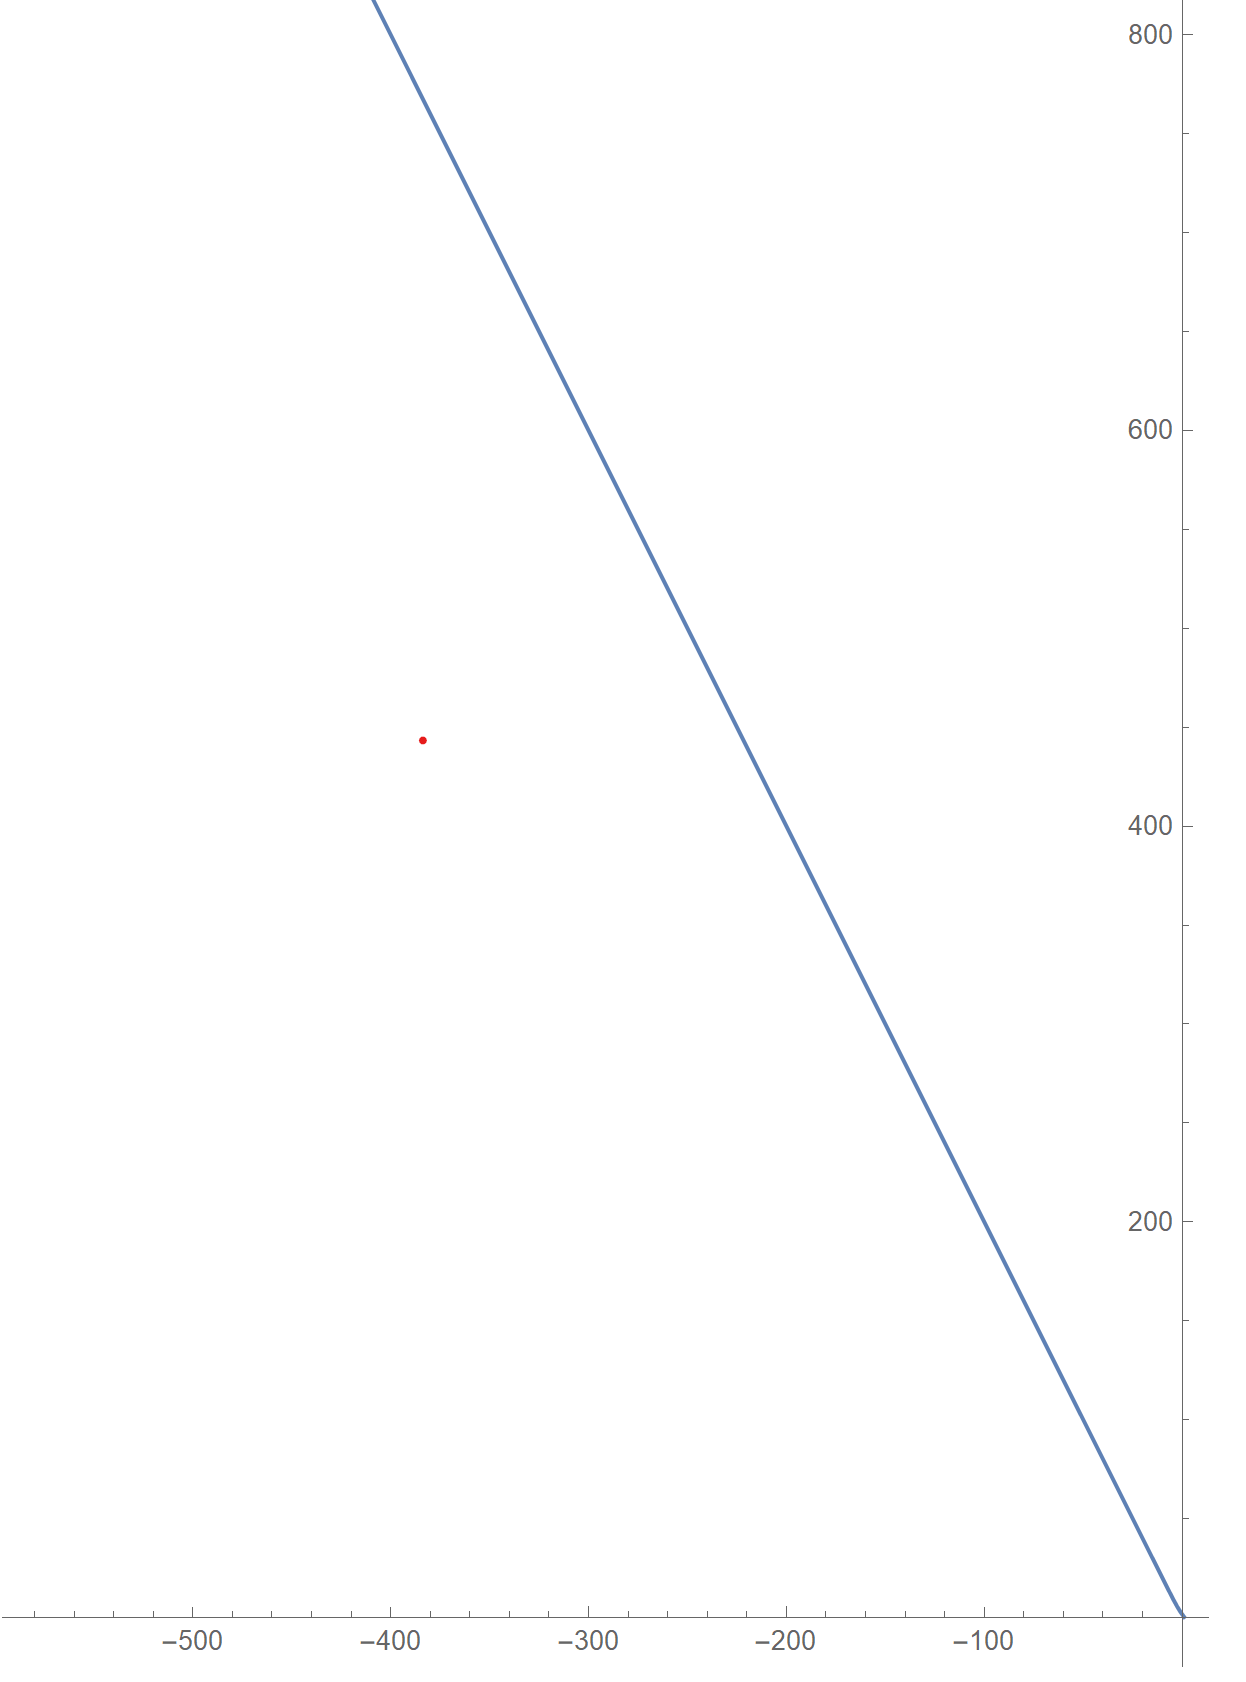
Update: Modification of the second method for the example in OP's update:
ClearAll[a, b, aA, x0]
aA[a_, b_] := {{2 a b - a - b, a b - a - b}, {2 (a + b - a b),
2 ( a + b) - a b}}
x0 = {1, 1/3};
Manipulate[Graphics[{AbsolutePointSize[10], ColorData[97]@1, Arrowheads[.03],
   Point@x0,
   Arrow[Partition[NestList[aA[a, b].# &, x0, t - 1], 2, 1]]},
  AspectRatio -> 1, ImageSize -> 400, Frame -> True, Axes -> True,
  PlotRange -> All], Spacer[10], Spacer[10], Spacer[10],
 Grid[{{Item[Labeled[Control@{{a, 1, Style["a", 18]}, -1, 1, Slider,
        ImageSize -> Small}, Style[Dynamic[a], 20], Top],
     Background -> (Dynamic@ColorData[{"Rainbow", {-1, 1}}][a])],
    Item[Labeled[Control@{{b, .5, Style["b", 18]}, -1, 1, Slider,
        ImageSize -> Small}, Style[Dynamic[b], 20], Top],
     Background -> (Dynamic@ColorData[{"Rainbow", {-1, 1}}][b])]}},
  Alignment -> {Center, Center}, ItemSize -> {16, 16}, Dividers -> All],
 Spacer[10],
 {{t, 1}, 1, 15, 1, Animator, AnimationRunning -> False, DisplayAllSteps -> True},
 Alignment -> Center, ControlPlacement -> Left]
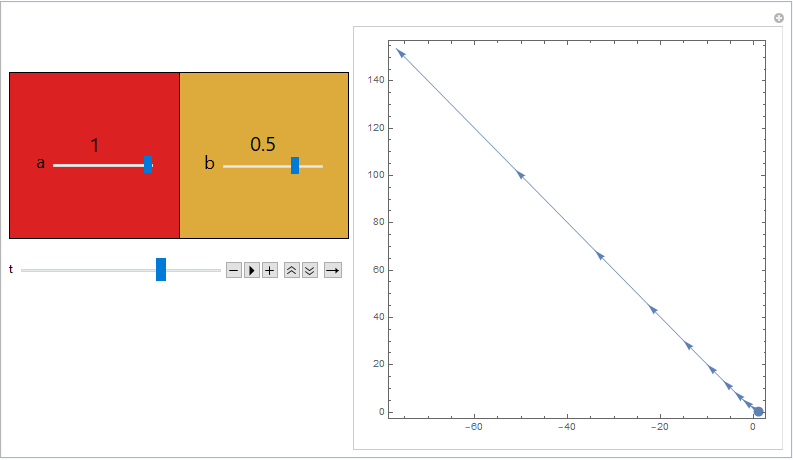
If you want to control the starting point with a Locator:
Manipulate[Labeled[Graphics[{AbsolutePointSize[10], ColorData[97]@#,
      Arrowheads[.03], Point@pt[[#]],
      Arrow[Partition[NestList[aA[a, b].# &, pt[[#]], t - 1], 2, 1]]} & /@
        Range[Length[pt]], ImageSize -> 400, Frame -> True,
   Axes -> True, PlotRange -> All, AspectRatio -> 1],
  Dynamic[pt[[1]]], Top], Spacer[10], Spacer[10], Spacer[10],
 Grid[{{Item[Labeled[Control@{{a, 1, Style["a", 18]}, 0, 1, Slider,
        ImageSize -> Small}, Style[Dynamic[a], 20], Top],
     Background -> (Dynamic@ColorData[{"Rainbow", {-1, 1}}][a])],
    Item[Labeled[Control@{{b, .5, Style["b", 18]}, -1, 1, Slider,
        ImageSize -> Small}, Style[Dynamic[b], 20], Top],
     Background -> (Dynamic@ColorData[{"Rainbow", {-1, 1}}][b])]}},
  Alignment -> {Center, Center}, ItemSize -> {16, 16}, Dividers -> All],
  {{pt, {x0}}, Locator, Appearance -> None,  LocatorAutoCreate -> False},
 Spacer[10],
 {{t, 1}, 1, 15, 1, Animator, AnimationRunning -> False, DisplayAllSteps -> True},
  Alignment -> Center, ControlPlacement -> Left]
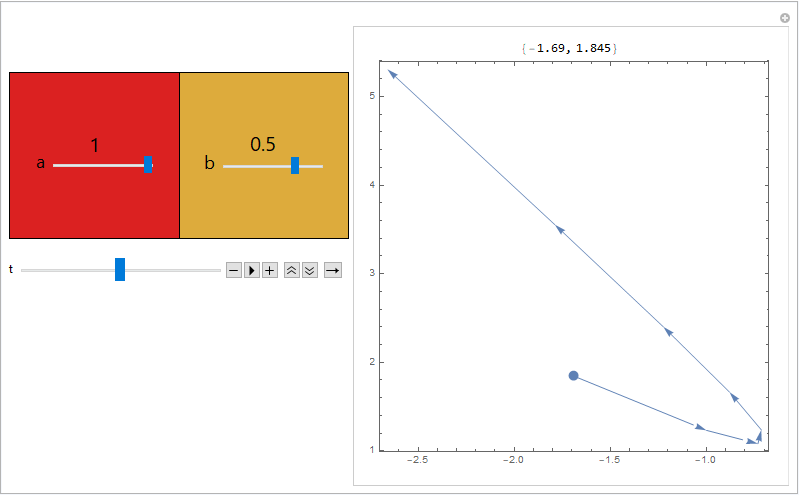



MatrixPower[]. $\endgroup$