3
$\begingroup$

I'm trying to generate a spherical polygon on a unit-sphere from a set of points, but I'm running into some trouble. I've looked through previous answers to questions similar to/identical to mine:

Fast spherical polygon

An efficient circular arc primitive for Graphics3D

Geodesics on a sphere

However, I am struggling to implement any of these methods myself. My problem is straightforward. Given a set of points lying on a sphere, I simply want to draw a spherical polygon by connecting the points with geodesics and then fill the area the polygon encloses with some color. I'm also trying to plot a curve that the polygon approximates and have that filled with a different color on a different plot as well.

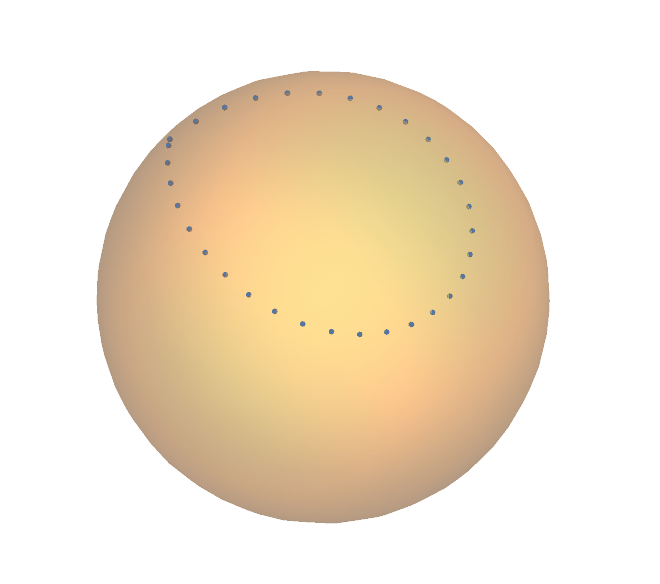
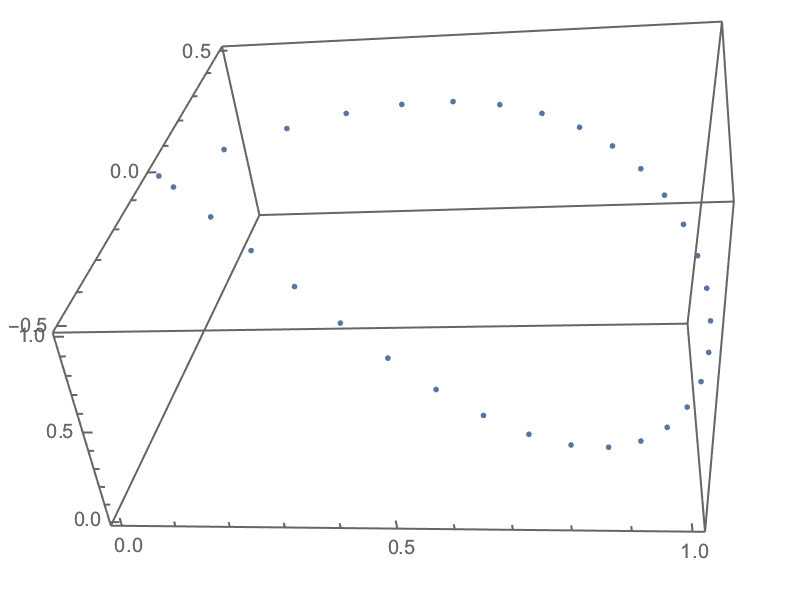
For example, the points given by:

pts = Table[{Sin[t], Sin[t]*Cos[t], Cos[t]^2}, {t, 0, Pi, .1}]

enter image description here

Show[
  ContourPlot3D[x^2 + y^2 + z^2 == 1, {x, -1, 1}, {y, -1, 1}, {z, -1, 1}, 
    ContourStyle -> Opacity[0.3], Mesh -> None], 
  ListPointPlot3D[pts], 
  Boxed -> False, Axes -> False]

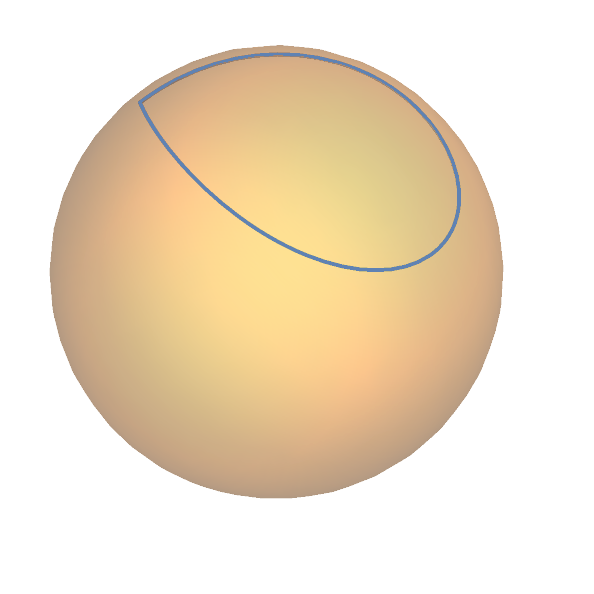
enter image description here

And the curve:

Show[
  ContourPlot3D[x^2 + y^2 + z^2 == 1, {x, -1, 1}, {y, -1, 1}, {z, -1, 1}, 
    ContourStyle -> Opacity[0.3], Mesh -> None], 
 ParametricPlot3D[{Sin[t], Sin[t]*Cos[t], Cos[t]^2}, {t, 0, Pi}], 
 Boxed -> False, Axes -> False]

enter image description here

These problems appear to be answered in the links I've included, but I can't implement my own set of points for some reason. I've tried replicating Joseph O'Rourke's result from Geodesics on a sphere, which is what I'm trying to make in the first place, but to no avail.

$\endgroup$

2 Answers 2

3
$\begingroup$

One approach is to construct such a polygon through CSG. The advantage here is that the result will stitch together perfectly with its complement.

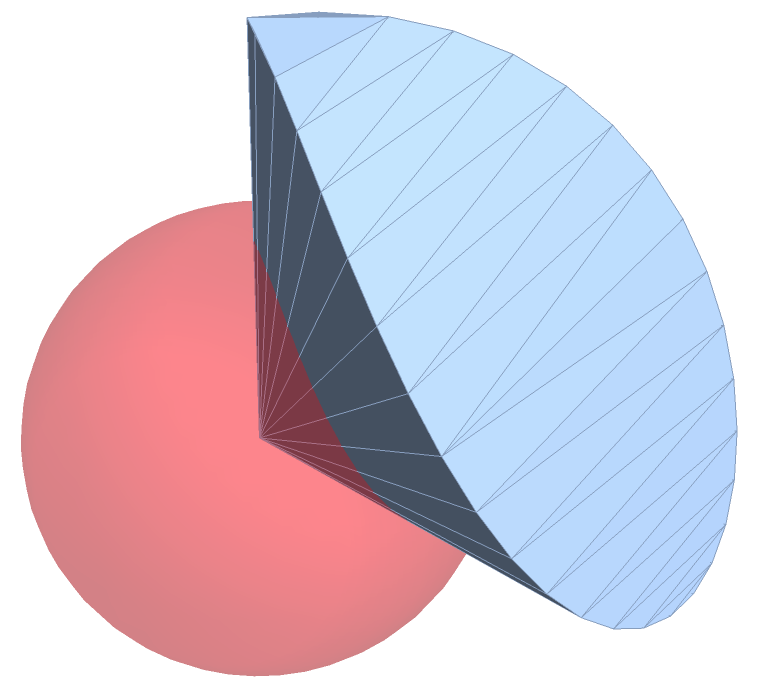
The idea will be to intersect a particular wedge with a ball.

mr = RepairMesh[DiscretizeRegion[Polygon[{2 #1, 2 #2, {0, 0, 0}} & @@@ Partition[pts, 2, 1, 1]]], "HoleEdges"];
wedge = BoundaryMeshRegion[MeshCoordinates[mr], MeshCells[mr, 2]];

Show[wedge, Graphics3D[{Red, Opacity[.3], Ball[]}]]

Let's intersect:

ball = BoundaryDiscretizeRegion[Ball[]];
int = RegionIntersection[ball, wedge];

And for fun, take a look at the operation:

prettyregs = Region[#, Boxed -> True, BoxStyle -> Opacity[.3], ImageSize -> 180, 
  PlotRange -> {{-1, 2}, {-1, 1}, {-1, 2}}] & /@ {ball, wedge, int};

Row[Riffle[prettyregs, {"\[Times]", "\[LongEqual]"}], Spacer[1], 
  BaseStyle -> {Bold, GrayLevel[.3], 36}]

enter image description here

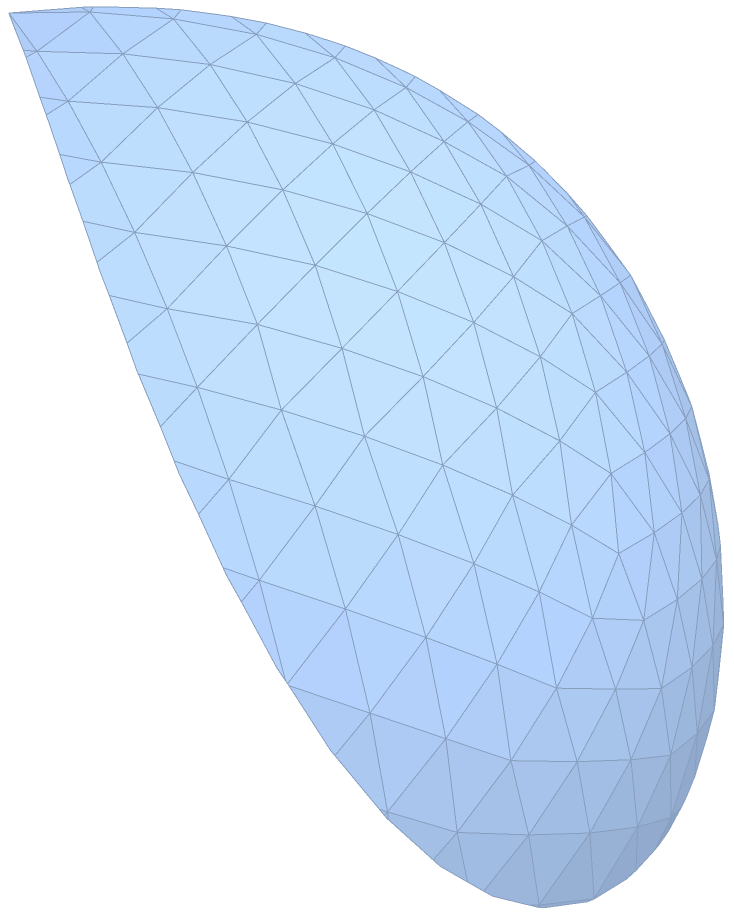
We then remove the sides of the wedge to obtain our polygon:

polyin = MeshRegion[
  MeshCoordinates[int], 
  Pick[MeshCells[int, 2], RegionMember[mr, PropertyValue[{int, 2}, MeshCellCentroid]], False]
]

We can apply a similar idea to get the other face:

enter image description here

diff = RegionDifference[ball, wedge]

polyout = MeshRegion[
  MeshCoordinates[diff], 
  Pick[MeshCells[diff, 2], RegionMember[mr, PropertyValue[{diff, 2}, MeshCellCentroid]], False]
];

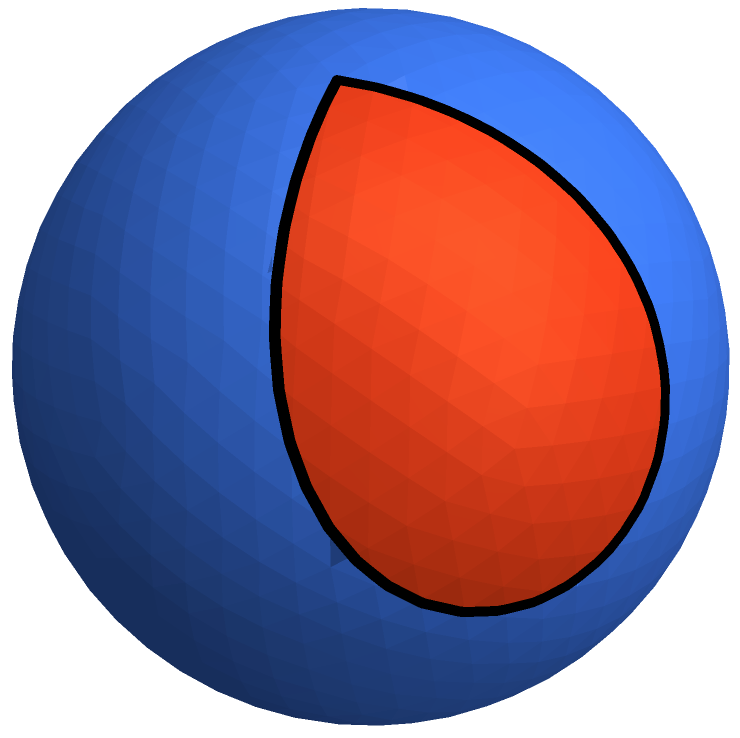
We can visualize the scene:

holes = FindMeshDefects[polyin, "HoleEdges", "Cell"]["HoleEdges"];

Show[
  Region[polyin, BaseStyle -> ColorData[112, 1]], 
  Region[polyout, BaseStyle -> ColorData[112, 2]], 
  Graphics3D[GraphicsComplex[MeshCoordinates[polyin], {Black, holes /. Line -> Tube}]]
]

And the union stitches together with no holes or overlaps:

FindMeshDefects[RegionUnion[polyin, polyout], All, "Cell"]
<|"FlippedFaces" -> {}, "HoleEdges" -> {}, "TinyFaces" -> {},
   "SingularVertices" -> {}, "DanglingEdges" -> {}, 
   "SingularEdges" -> {}, "TinyComponents" -> {}, 
   "TJunctionEdges" -> {}, "IsolatedVertices" -> {}, "OverlappingFaces" -> {}|>

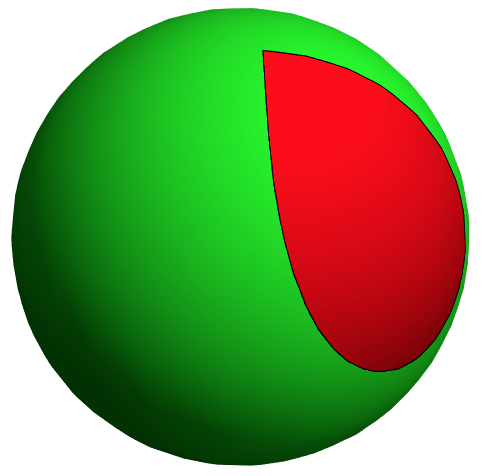
If you only care about visualization, you could create the wedge and simply feed it into ContourPlot3D:

rmf = RegionMember[wedge];
Show[
  ContourPlot3D[x^2 + y^2 + z^2 == 1, {x, -1, 1}, {y, -1, 1}, {z, -1, 1}, 
    ContourStyle -> Red, Mesh -> None, Boxed -> False, Axes -> False, 
    RegionFunction -> Function[{x, y, z}, rmf[{x, y, z}]]],
  ContourPlot3D[x^2 + y^2 + z^2 == 1, {x, -1, 1}, {y, -1, 1}, {z, -1, 1}, 
    ContourStyle -> Green, Mesh -> None, 
    RegionFunction -> Function[{x, y, z}, !rmf[{x, y, z}]]]
]

$\endgroup$
1
$\begingroup$

Not the best, but one possible approach:

I increased the number of initial boundary points due to the error on the boundary.

pts2d = Table[{Sin[t], Sin[t]*Cos[t]}, {t, 0, Pi, .05}];

res = DiscretizeRegion[
   BoundaryMeshRegion[pts2d, Line[Append[Range[Length[pts2d]], 1]]], 
   MeshRefinementFunction -> 
    Function[{vertices, area}, 
     Block[{x, y}, {x, y} = Mean[vertices]; 
      If[1 - x^2 - y^2 < .15, area > 0.0005, area > 0.01]]]];

polys = MeshPrimitives[
   MeshRegion[{#1, #2, Sqrt[1 - (#1^2 + #2^2)]} & @@@ 
     MeshCoordinates[res], MeshCells[res, 2]], 2];

Show[{ContourPlot3D[
   x^2 + y^2 + z^2 == 1, {x, -1, 1}, {y, -1, 1}, {z, -1, 1}, 
   ContourStyle -> Opacity[0.3], Mesh -> None], ListPointPlot3D[pts], 
  Graphics3D[{Green, polys}]}, Boxed -> False, Axes -> False]
$\endgroup$

Your Answer

By clicking “Post Your Answer”, you agree to our terms of service and acknowledge you have read our privacy policy.

Not the answer you're looking for? Browse other questions tagged or ask your own question.