40
$\begingroup$

For artistic reasons, I want to draw an extremely dense StreamPlot with something like a thousand streamlines. I tried setting StreamPoints -> {Automatic, d} where $d$ is a small value specifying the minimum distance between streamlines, but after a point reducing the value of $d$ stops having an effect.

GraphicsColumn[
 StreamPlot[{-1 - x^2 + y, 1 + x - y^2}, {x, -3, 3}, {y, -3, 3}, 
    StreamPoints -> {Automatic, #}, ImageSize -> Medium] & /@ {1, 0.3,
    0.1, 0.03, 0.01}]

enter image description here

The same thing happens when setting StreamPoints -> n for increasing values of $n$, or when manually seeding hundreds of seed points; Mathematica silently refuses to plot any more streamlines.

How can I get around this? Is it possible to plot arbitrarily closely spaced streamlines using StreamPlot?

Update: To clarify, I want to keep the style of the fully-automatic default StreamPlot, which attempts to maintain a uniform spacing between streamlines, and just make it denser. So I don't want to get rid of the minimum distance entirely; I just want to lower it. To save everyone some time, here is what I find unsatisfactory about all the documented settings for StreamPoints.

  • None: Obviously no good.
  • $n$: Stops having an effect somewhere between 50 and 100.
  • Automatic, Coarse, and Fine: Not dense enough.
  • {p1, p2, ...} and {{p1, g1}, ...}: See n.
  • {spec, d}: d stops having an effect somewhere between 0.2 and 0.1.
  • {spec, {dStart, dEnd}}: Strangely, increasing dEnd plots more streamlines. Compare {Automatic, {0.5, 10}} with {Automatic, 0.5} and {Automatic, {0.5, 0.5}}. I don't understand this setting at all.
  • {spec, d, len}: When spec is Automatic, len has no effect as far as I can tell. On the other hand, when spec is {p1, p2, ...}, len causes d to be ignored completely.
$\endgroup$
8
  • $\begingroup$ Are you sure? Your 3rd & 4th images above are different. Please check again but using ImageSize->(eg) 700 so you can see differences. $\endgroup$
    – dwa
    Commented Dec 7, 2012 at 6:09
  • $\begingroup$ @dwa: They are slightly different, but the fourth image is certainly not 3 times denser. I've updated with a hopefully more convincing example. $\endgroup$
    – user484
    Commented Dec 7, 2012 at 6:24
  • $\begingroup$ Great question. Now I have reason to explore the inner workings of StreamPlot, which I've never really considered before. $\endgroup$
    – Mr.Wizard
    Commented Dec 7, 2012 at 11:19
  • $\begingroup$ Actually, the uniform spacing between streamlines that you like so much isn't really that useful. In many applications, one wants the streamline density to vary with the field strength. The automatic minimum distance actually prevents that! So I find it necessary to choose my own seed points to make sure that the function is represented faithfully. When you ask for longer streamlines, it becomes harder on average to enforce a minimum separation, and spacings that look even in one region may not in another region. $\endgroup$
    – Jens
    Commented Dec 7, 2012 at 16:52
  • $\begingroup$ Two related questions: Mathematica slope fields and I'd like to display field lines for a point charge in 3 dimensions $\endgroup$
    – Jens
    Commented Dec 7, 2012 at 17:07

4 Answers 4

42
$\begingroup$

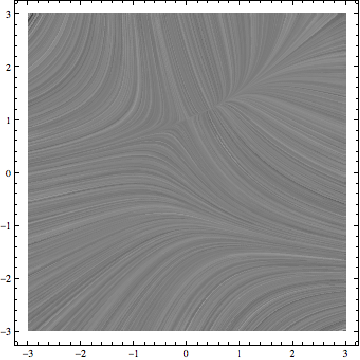
Maybe this isn't what you need, but for aesthetic reasons I would suggest for such a high streamline density to use a different plot altogether:

LineIntegralConvolutionPlot[{-1 - x^2 + y, 1 + x - y^2}, {x, -3, 
  3}, {y, -3, 3}, LineIntegralConvolutionScale -> 2, 
 ColorFunction -> GrayLevel, RasterSize -> 300]

convolutionPlot1

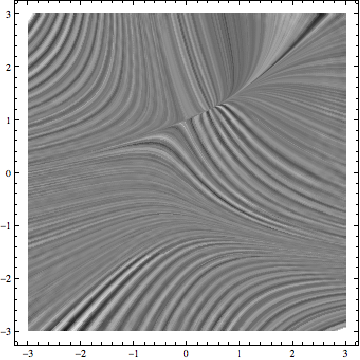
LineIntegralConvolutionPlot[{{-1 - x^2 + y, 1 + x - y^2}, 
  Image[Table[((-1)^i (-1)^j + 1)/2, {i, 45}, {j, 45}]]}, {x, -3, 
  3}, {y, -3, 3}, LineIntegralConvolutionScale -> 2, 
 ColorFunction -> GrayLevel, RasterSize -> 300]

convolutionPlot2

There are many additional options for LineIntegralConvolutionPlot, but I like its smoothed, continuous representation of the streamlines.

Edit

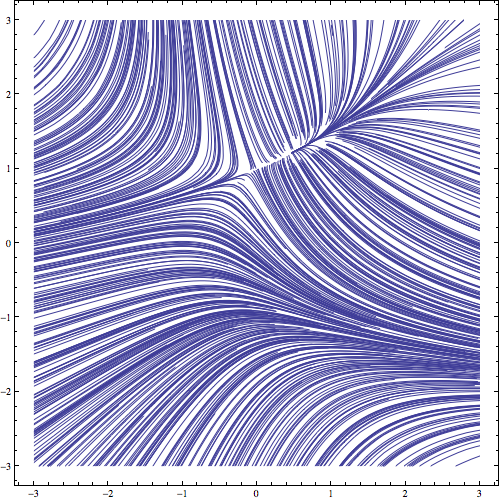
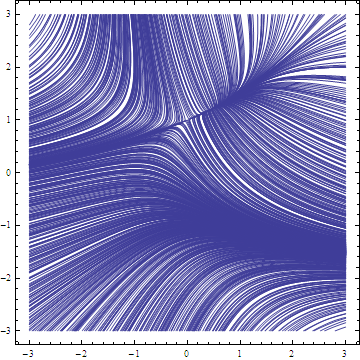
Here is a simple way to create arbitrary many streamlines by circumventing the ceiling that StreamPlot appears to impose on us:

t = Map[StreamPlot[{-1 - x^2 + y, 1 + x - y^2}, {x, -3, 3}, {y, -3, 
      3}, StreamStyle -> "Line", 
     StreamPoints -> RandomReal[{-3, 3}, {#, 2}], ImageSize -> 500] &,
    ConstantArray[50, 20]];

Show[t]

streamplot

The trick I used is to generate a whole list of StreamPlots, all with different seed points (here chosen randomly, but you could tweak that at will). Each single plot is given a fixed number of seed points that doesn't have to be very large (here 50).

But then I superimpose all these plots using Show, and the result is an arbitrarily dense array of stream lines because the individual plots don't know anything about how close stream lines in the other plots are.

Edit 2

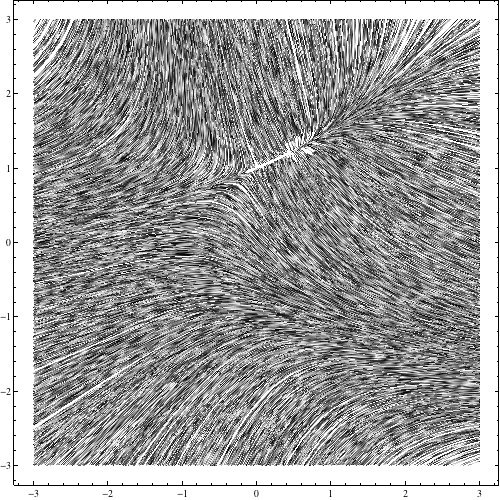
For fun, I made this stream plot with nominally 5000 seed points, and gave it random gray scales to see how similar it looks to the LineIntegralConvolutionPlot above. Here is the result:

t = Map[StreamPlot[{-1 - x^2 + y, 1 + x - y^2}, {x, -3, 3}, {y, -3, 
      3}, StreamStyle -> "Line", 
     StreamPoints -> RandomReal[{-3, 3}, {#, 2}], 
     StreamColorFunction -> (GrayLevel[RandomReal[]] &), 
     ImageSize -> 500] &, ConstantArray[50, 100]];

Show[t]

gray stream lines

$\endgroup$
7
  • 1
    $\begingroup$ Thanks, I'm aware of line integral convolution, but I really do want a streamline plot. I'll be rendering it with StreamStyle -> "Line" and ImageSize -> Large if that helps convince you of the aesthetic I'm going for. $\endgroup$
    – user484
    Commented Dec 7, 2012 at 6:41
  • $\begingroup$ @RahulNarain OK, this really is a different problem then. I'll edit my answer to address this shortcoming. $\endgroup$
    – Jens
    Commented Dec 7, 2012 at 7:13
  • 1
    $\begingroup$ Clever! +1. However, what makes the output of StreamPlot nice is that it attempts to keep the streamlines uniformly spaced, which is no longer the case with this approach. $\endgroup$
    – user484
    Commented Dec 7, 2012 at 9:07
  • $\begingroup$ The spacing depends only on your choice of seed points. $\endgroup$
    – Jens
    Commented Dec 7, 2012 at 15:03
  • 4
    $\begingroup$ Thanks a lot: I used your approach in my thesis, and it looked pretty good! $\endgroup$
    – Chiffa
    Commented Dec 16, 2012 at 22:23
28
$\begingroup$

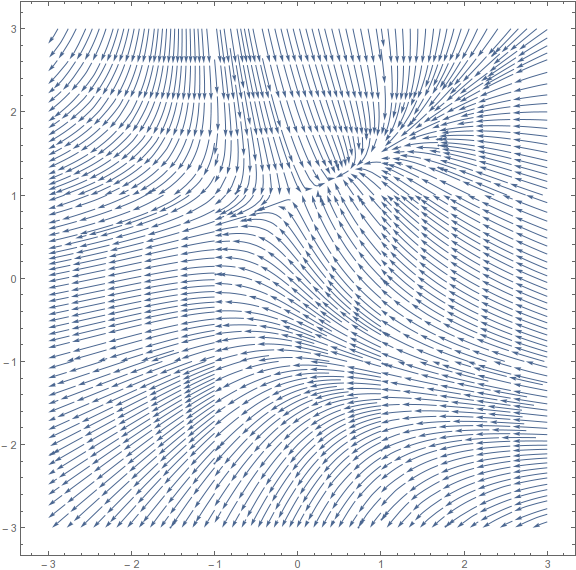
It seems to help to include a maximum length in the StreamPoints setting:

StreamPlot[{-1 - x^2 + y, 1 + x - y^2}, {x, -3, 3}, {y, -3, 3}, 
 StreamPoints -> {Tuples[Range[-3, 3, 0.2], 2], Automatic, 10}, 
 ImageSize -> Medium, StreamStyle -> "Line"]

enter image description here

Count[%, _Line, -1]
(* 960 *)
$\endgroup$
5
  • 1
    $\begingroup$ Interesting observation (+1). $\endgroup$
    – Jens
    Commented Dec 7, 2012 at 15:02
  • $\begingroup$ Interesting. However, it seems this only works by overriding the minimum distance between streamlines. Now the streamlines are nonuniformly dense (e.g. lower right), even after replacing Automatic with a fixed value. Also, this doesn't work when using automatic seed points instead of Tuples[...]. $\endgroup$
    – user484
    Commented Dec 7, 2012 at 16:08
  • $\begingroup$ I've updated the question; sorry about the confusion. $\endgroup$
    – user484
    Commented Dec 7, 2012 at 16:43
  • $\begingroup$ This inhomogeneity seems to me quite unavoidable as a result of the fact that you can't predict that the spacing will remain uniform everywhere if you set it to be approximately uniform in some subregion of the plot. Maybe the reason this answer works in the first place is that Mathematica knows about this uncertainty and stops obsessing about minimum separation when you ask for long stream lines where it becomes too hard to predict the separation over long "times" on the streamline. $\endgroup$
    – Jens
    Commented Dec 7, 2012 at 16:57
  • 1
    $\begingroup$ @Jens, Mathematica normally deals with the non-uniform density by terminating some of the streamlines as their spacing decreases. It's not clear to me why this stops happening when you specify a maximum length for the streamlines. $\endgroup$ Commented Dec 7, 2012 at 19:19
8
$\begingroup$

Edit: I've found the error I've had, fixed it, and generalized the solution:

The new function denseStreamPlot is now 4 different functions that you could use:

Subdivide2D[{xmin_, xmax_, nx_}, {ymin_, ymax_, ny_}] := 
 Tuples[{Subdivide[xmin, xmax, nx], Subdivide[ymin, ymax, ny]}]
Subdivide2D[{xmin_, xmax_}, {ymin_, ymax_}, n_] := 
 Subdivide2D[{xmin, xmax, n }, {ymin, ymax, n}]
AddPoints[p1_, p2_] := {p1[[1]] + p2[[1]], p1[[2]] + p2[[2]]}


getStreamPointsBiDiagonal[{xmin_, xmax_}, {ymin_, ymax_}] := 
 Module[{innerCellPoints, lastSets, sets}, 
  sets = Partition[
    Subdivide2D[{xmin, xmax, n - 1}, {ymin, ymax, n - 1}], n];
  lastSets = {sets[[-1]], (Transpose@sets)[[-1]]};
  sets = sets[[;; -2, ;; -2]];
  innerCellPoints = 
   Table[{i (ymax - ymin)/(
      k (n - 1)), (1 - (-1)^i)/2 (ymax - ymin)/(n - 1) + 
      i (-1)^i (ymax - ymin)/(k (n - 1))} , {i, 0, k - 1}];
  sets = Join[
    Flatten[Table[
      Table[AddPoints[pt, #] & /@ set, {set, sets}], {pt, 
       innerCellPoints}], 1], lastSets]]

SetAttributes[denseStreamPlot, {HoldAll}];
denseStreamPlot[expr_, {x_, xmin_, xmax_}, {y_, ymin_, ymax_}, 
  streamPointsMethod_Symbol: getStreamPointsBiDiagonal, 
  opts : OptionsPattern[]] :=
 Module[{innerCellPoints, lastSets, sets},
  Show[StreamPlot[expr, {x, xmin, xmax}, {y, ymin, ymax}, 
      StreamPoints -> #, opts] & /@ 
    streamPointsMethod[{xmin, xmax}, {ymin, ymax}]]]

In here, the function denseStreamPlot plots the actual graph, and the function getStreamPointsBiDiagonal gives the point-sets for the streams. For example, the code

n = 6;
k = 10;
GraphicsRow[{denseStreamPlot[{-1 - x^2 + y, 1 + x - y^2}, {x, -3, 
    3}, {y, -3, 3}, ImageSize -> Medium],
  Show[{denseStreamPlot[{-1 - x^2 + y, 1 + x - y^2}, {x, -3, 
      3}, {y, -3, 3}, ImageSize -> Medium, StreamStyle -> "Line"],
    ListPlot[Flatten[getStreamPointsBiDiagonal[{-3, 3}, {-3, 3}], 1], 
     PlotStyle -> Red]}],
  denseStreamPlot[{-1 - x^2 + y, 1 + x - y^2}, {x, -3, 3}, {y, -3, 3},
    ImageSize -> Medium, StreamStyle -> "Line"]}
 ]

produces enter image description here where the red dots are the plot-points. n is the division of the region to a grid of n by n, and every cell in this grid is divided into k points inside the cell, and it's seen in this plot.

I've kept the option to change the StreamPointFunction as you will, so, for instance, define

getStreamPointsDiagonal[{xmin_, xmax_}, {ymin_, ymax_}] := 
 Module[{innerCellPoints, lastSets, sets}, 
  sets = Partition[
    Subdivide2D[{xmin, xmax, n - 1}, {ymin, ymax, n - 1}], n];
  lastSets = {sets[[-1]], (Transpose@sets)[[-1]]};
  sets = sets[[;; -2, ;; -2]];
  innerCellPoints = 
   Table[{i (ymax - ymin)/(k (n - 1)), 
     i (ymax - ymin)/(k (n - 1))} , {i, 0, k - 1}];
  sets = Join[
    Flatten[Table[
      Table[AddPoints[pt, #] & /@ set, {set, sets}], {pt, 
       innerCellPoints}], 1], lastSets]]

and run the same line of code above, only with the getStreamPointsDiagonal function to get

n = 6;
k = 10;

GraphicsRow[{denseStreamPlot[{-1 - x^2 + y, 1 + x - y^2}, {x, -3, 
    3}, {y, -3, 3}, getStreamPointsDiagonal, ImageSize -> Medium],
  Show[{denseStreamPlot[{-1 - x^2 + y, 1 + x - y^2}, {x, -3, 
      3}, {y, -3, 3}, ImageSize -> Medium, StreamStyle -> "Line"],
    ListPlot[Flatten[getStreamPointsDiagonal[{-3, 3}, {-3, 3}], 1], 
     PlotStyle -> Red]}],
  denseStreamPlot[{-1 - x^2 + y, 1 + x - y^2}, {x, -3, 3}, {y, -3, 3},
    getStreamPointsDiagonal, ImageSize -> Medium, 
   StreamStyle -> "Line"]}
 ]

enter image description here

The old errorous function can be reobtained as a special case of the above code:

n = 2;
k = 150;
GraphicsRow[{denseStreamPlot[{-1 - x^2 + y, 1 + x - y^2}, {x, -3, 
    3}, {y, -3, 3}, getStreamPointsDiagonal, ImageSize -> Medium],
  Show[{denseStreamPlot[{-1 - x^2 + y, 1 + x - y^2}, {x, -3, 
      3}, {y, -3, 3}, getStreamPointsDiagonal, ImageSize -> Medium, 
     StreamStyle -> "Line"],
    ListPlot[Flatten[getStreamPointsDiagonal[{-3, 3}, {-3, 3}], 1], 
     PlotStyle -> Red]}],
  denseStreamPlot[{-1 - x^2 + y, 1 + x - y^2}, {x, -3, 3}, {y, -3, 3},
    getStreamPointsDiagonal, ImageSize -> Medium, 
   StreamStyle -> "Line"]}
 ]

enter image description here Original Answer: I've used @Jens's approach to create a uniformly-spaced answer. Just copy the following functions:

n = 10;
k = 15;
SetAttributes[denseRandomStreamPlot, {HoldAll}];
denseRandomStreamPlot[expr_, rng1_, rng2_, opts : OptionsPattern[]] :=
  Show@Map[
   StreamPlot[expr, rng1, rng2, 
     StreamPoints -> 
      Transpose[{RandomReal[rng1[[2 ;;]], #], 
        RandomReal[rng2[[2 ;;]], #]}], opts] &, ConstantArray[n, k]]

and

SetAttributes[denseStreamPlot, {HoldAll}];
denseStreamPlot[expr_, {x_, xmin_, xmax_}, {y_, ymin_, ymax_}, 
  opts : OptionsPattern[]] := Module[{nn, samp, sets},
  sets =
   Table[Transpose[{Subdivide[xmin, xmax - (xmax - (xmin))/n, n - 1], 
       Subdivide[ymin, ymax - (ymax - (ymin))/n, n - 1]}] + 
     Transpose[{ConstantArray[i (xmax - xmin)/(n k), n], 
       ConstantArray[i (ymax - ymin)/(n k), n]}], {i, 0, k}];
  Show@(StreamPlot[expr, {x, xmin, xmax}, {y, ymin, ymax}, 
       StreamPoints -> #, opts] & /@ sets)]

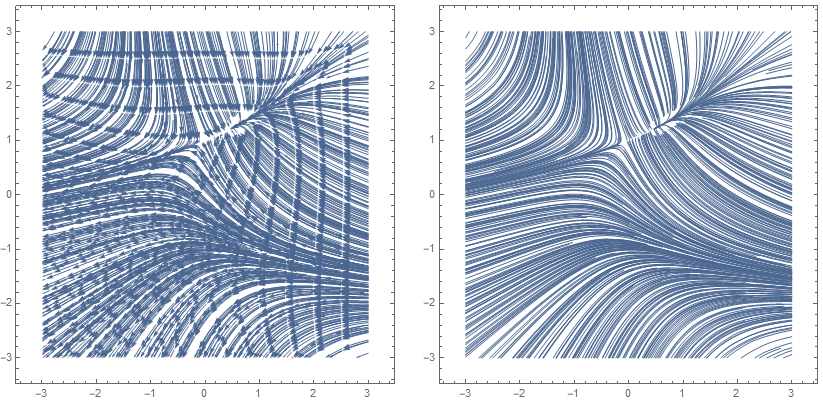
In here there are two functions - denseRandomStreamPlot & denseStreamPlot. denseRandomStreamPlot is just an encapsulation of @Jens's anwer. Meaning that the code

n = 50;
k = 20;
GraphicsRow[{denseRandomStreamPlot[{-1 - x^2 + y, 
    1 + x - y^2}, {x, -3, 3}, {y, -3, 3}, ImageSize -> Medium],
  denseRandomStreamPlot[{-1 - x^2 + y, 1 + x - y^2}, {x, -3, 
    3}, {y, -3, 3}, ImageSize -> Medium, StreamStyle -> "Line"]}]

outputs (I think it's better with arrows) Random plots
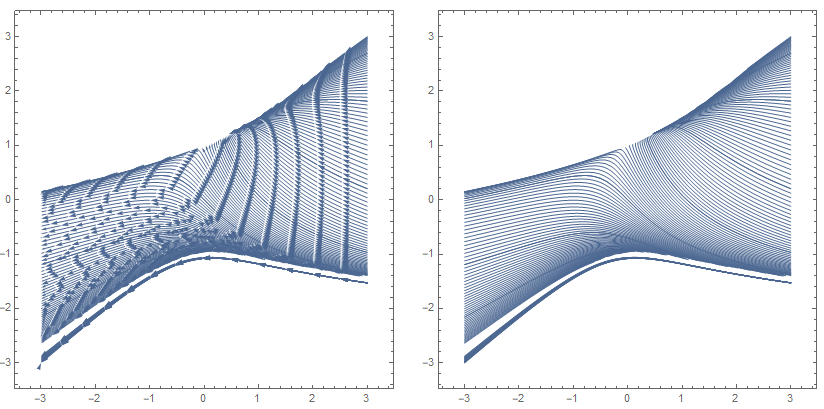
The other function is my attempt to do the same thing while using different evenly-spaced substitutions of the 2D region. Meaning that the code,

n = 10;
k = 20;
GraphicsRow[{denseStreamPlot[{-1 - x^2 + y, 1 + x - y^2}, {x, -3, 
    3}, {y, -3, 3}, ImageSize -> Medium], 
  denseStreamPlot[{-1 - x^2 + y, 1 + x - y^2}, {x, -3, 3}, {y, -3, 3},
    ImageSize -> Medium, StreamStyle -> "Line"]}]

gives
enter image description here

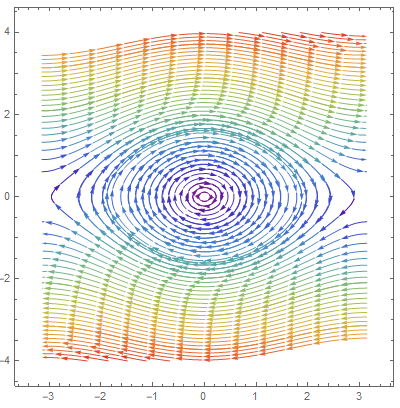
Note that the evenly-spaced points method doesn't work properly in this case (I don't know why), but it works quite well for other fields I've tried. For example, in the case of a simple pendulum,

n = 10;
k = 10;
denseStreamPlot[{p, -Sin[\[Theta]]}, {\[Theta], -\[Pi], \[Pi]}, \
{p, -4, 4}, StreamColorFunction -> "Rainbow"]

produces
enter image description here

$\endgroup$
0
7
$\begingroup$

Here's a stupidly simple thing I came up with for my own question: just divide the domain into smaller blocks, make separate StreamPlots for each of them, and stitch them together.

f[x_, y_] := {-1 - x^2 + y, 1 + x - y^2};
xrange = {-3, 3};
yrange = {-3, 3};
xdivs = 3;
ydivs = 3;
xranges = Partition[Rescale[Range[0, xdivs], {0, xdivs}, xrange], 2, 1];
yranges = Partition[Rescale[Range[0, ydivs], {0, ydivs}, yrange], 2, 1];
(* Yuck. What's a more elegant way to get the subranges? *)

Show[Flatten@
  Table[StreamPlot[
    f[x, y], {x, First@xr, Last@xr}, {y, First@yr, Last@yr}, 
    StreamScale -> {0.2, Automatic, 0.01}, StreamPoints -> 100], {xr, 
    xranges}, {yr, yranges}], PlotRange -> All, ImageSize -> Large]

enter image description here

It's not perfect because you can clearly see the block boundaries, but it retains StreamPlot's nearly uniform streamline spacing.

$\endgroup$

Your Answer

By clicking “Post Your Answer”, you agree to our terms of service and acknowledge you have read our privacy policy.