1
$\begingroup$

I'm trying to make a StreamPlot in Mathematica with three variables. I already have two variables, x and y, that make an ellipse via

StreamPlot[{-y,x}] 

but I want the vectors to increase as you move radially out from the center (ie ideally I would want a third variable, v, so that it looked like

StreamPlot[{-v*y, v*x}] 

So that as v increased the vectors increased as well.

$\endgroup$
9
  • $\begingroup$ You might take a look at VectorPlot. $\endgroup$
    – march
    Commented Jun 16, 2015 at 16:14
  • $\begingroup$ I'm not sure I follow, but it sounds like you're looking for the formula of a vector field in just two variables with such a property. Something like Norm[{x, y}]*{-y, x}. $\endgroup$
    – Michael E2
    Commented Jun 16, 2015 at 16:18
  • $\begingroup$ I'm also not sure what you're looking for; rescaling the vectors as you propose won't change the stream lines at all. Are you looking for the actual arrowheads & lines in StreamPlot to be rescaled according to their location on in the plot? $\endgroup$ Commented Jun 16, 2015 at 16:38
  • $\begingroup$ Yes, @MichaelSeifert, that's what I'm looking for. The farther you go out from the center, I want the actual lines to be larger. What I'm doing is making an ellipse, and as you move outward the velocity around the ellipse should increase. $\endgroup$
    – pelkat
    Commented Jun 16, 2015 at 16:47
  • $\begingroup$ The vector field {x,-y} produces sets of lines that converge to x=0, not an ellipse $\endgroup$
    – pelkat
    Commented Jun 16, 2015 at 16:54

1 Answer 1

5
$\begingroup$

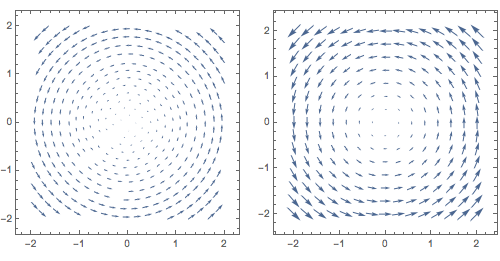
There is an option in StreamPlot called StreamScale that allows you to scale the vectors. In the documentation, we find that StreamScale -> {Automatic, 2, Automatic} results in scaled vectors. Alternatively, you can use VectorPlot, which automatically scales the vectors. Using

StreamPlot[{-y,x}, {x,-2,2}, {y,-2,2}, StreamScale -> {Automatic, 2, Automatic}]
VectorPlot[{-y,x}, {x,-2,2}, {y,-2,2}]

the results look like (with StreamPlot on the left and VectorPlot on the right):

enter image description here

Also see, for instance, Getting clearer StreamPlot output, How to get StreamPlot to draw many hundreds of streamlines?, and How can I get better control over StreamPlot? for more information about how StreamPlot works.

$\endgroup$

Your Answer

By clicking “Post Your Answer”, you agree to our terms of service and acknowledge you have read our privacy policy.

Not the answer you're looking for? Browse other questions tagged or ask your own question.