10
$\begingroup$

I am trying to implement simple birth death process. Why my code does not work? Any suggestion. Thanks. Cross posted http://community.wolfram.com/groups/-/m/t/1205656

birthDeath[λ_, μ_, initialPopulation_, numOfReaction_] :=     
 NestList[(
    Δt1 =  RandomVariate[ExponentialDistribution[λ  #]];
    Δt2 = RandomVariate[ExponentialDistribution[μ #]]; 
    If[Δt1 < Δt2, {# + 1}, {# - 1}]) &,  initialPopulation, numOfReaction]

birthDeath[3, 1, 10, 2]
$\endgroup$
0

5 Answers 5

5
$\begingroup$

How can I store Δt = Min[Δt1, Δt2] so that I can plot time vs population

One way is

birthDeath2[λ_, μ_, initialPopulation_, numOfReaction_] :=
        NestList[(Δt1 = RandomVariate[ExponentialDistribution[λ #[[2]]]];
                Δt2 =   RandomVariate[ExponentialDistribution[μ #[[2]]]];
                {Min[Δt1, Δt2],  If[Δt1 < Δt2, #[[2]] + 1, #[[2]] - 1]}) &,
  {0, initialPopulation}, numOfReaction]

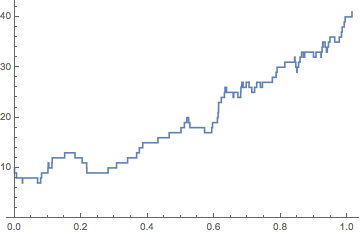
{Δt, pop} = Transpose[birthDeath2[3, 1, 10, 10]];
ListLinePlot[Transpose[{Accumulate@Δt, pop}], InterpolationOrder -> 0]

enter image description here

$\endgroup$
2
  • $\begingroup$ Thanks kglr. That's helped a lot. $\endgroup$ Commented Oct 20, 2017 at 22:21
  • $\begingroup$ @okkes, my pleasure. Thank you for the accept. $\endgroup$
    – kglr
    Commented Oct 20, 2017 at 22:54
6
$\begingroup$

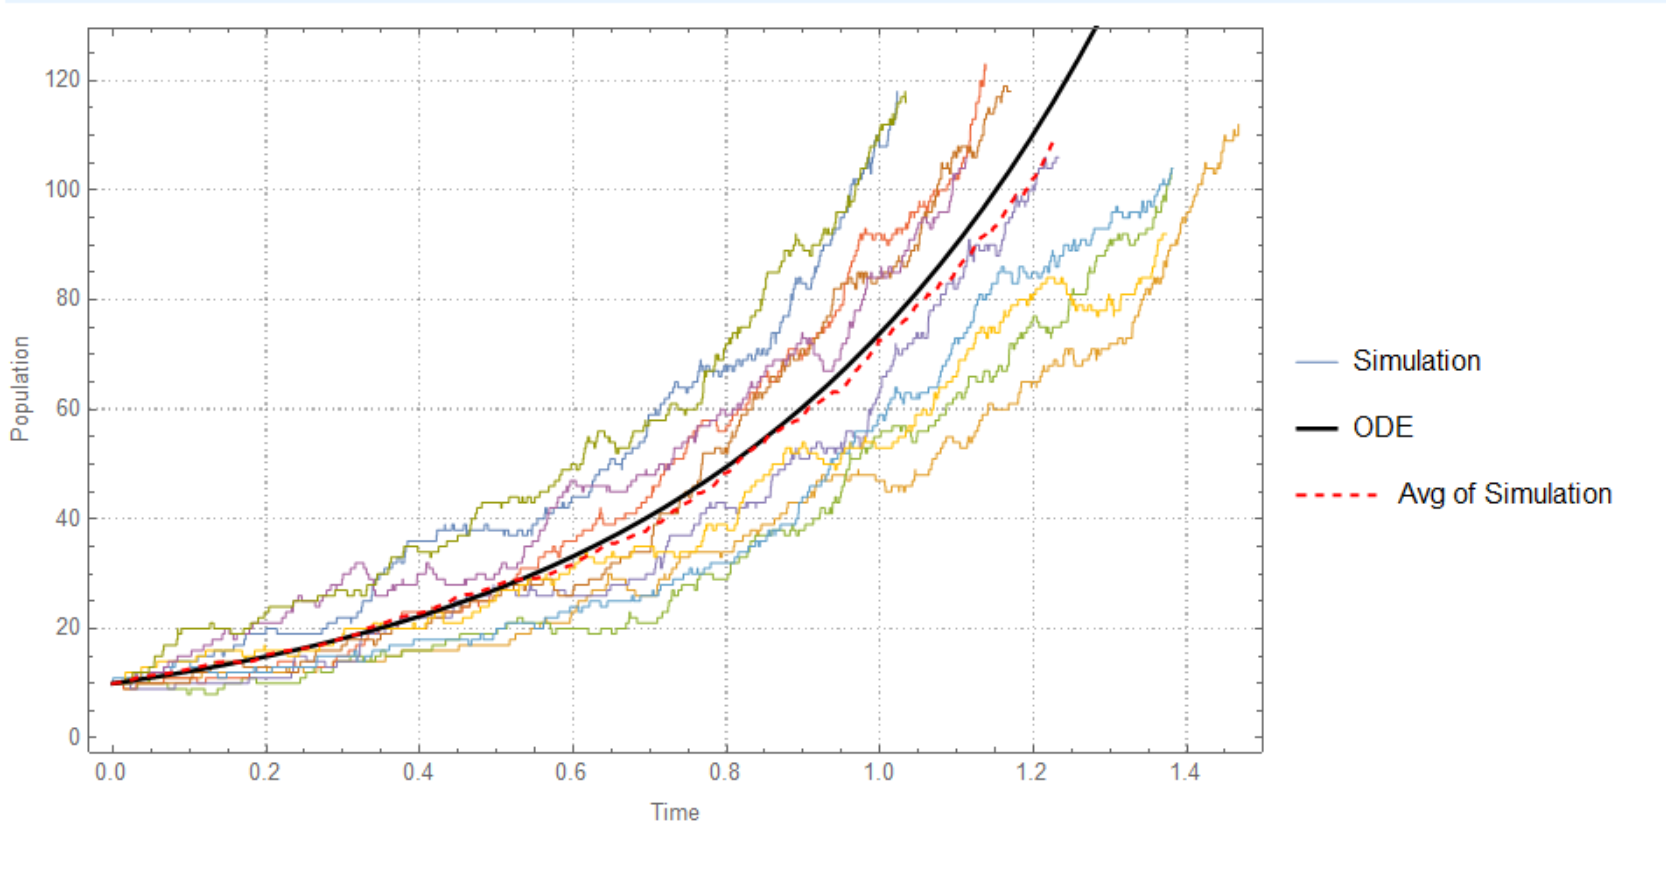
Here is improved version

   exact[\[Lambda]_, \[Mu]_, initialPopulation_] := 
 Module[{}, 
  DSolveValue[{p'[t] == (\[Lambda] - \[Mu]) p[t], 
    p[0] == initialPopulation}, p[t], t]]; 
birthDeath[\[Lambda]_, \[Mu]_, initialPopulation_, numOfReaction_] := 
 NestList[(\[CapitalDelta]t1 = 
     RandomVariate[ExponentialDistribution[\[Lambda] #[[2]]]];
    \[CapitalDelta]t2 = 
     RandomVariate[ExponentialDistribution[\[Mu] #[[2]]]];
    \[CapitalDelta]t = Min[\[CapitalDelta]t1, \[CapitalDelta]t2];
    {#[[1]] + \[CapitalDelta]t, 
     If[\[CapitalDelta]t1 < \[CapitalDelta]t2, #[[2]] + 1, #[[2]] - 
       1]}) &, {0, initialPopulation}, numOfReaction]


With[{\[Lambda] = 3, \[Mu] = 1, initialPopulation = 10, 
  numOfReaction = 1000, numOfsim = 10},
 sim = Table[
   birthDeath[\[Lambda], \[Mu], initialPopulation, numOfReaction], 
   numOfsim];
 Show[ListStepPlot[sim, PlotLegends -> {"Simulation"}, 
   PlotStyle -> Directive[AbsoluteThickness[0.2]], Frame -> True, 
   PlotTheme -> "Detailed", FrameLabel -> {"Time", "Population"}, 
   ImageSize -> Large], 
  Plot[Evaluate@exact[\[Lambda], \[Mu], initialPopulation], {t, 0, 
    Max@sim[[All, -1, 1]]}, PlotStyle -> {Black, Thick}, 
   PlotLegends -> {"ODE"}], 
  ListLinePlot[Mean@sim, PlotLegends -> {"Avg of Simulation"}, 
   PlotStyle -> {Red, Dashed}]]]

enter image description here

$\endgroup$
6
$\begingroup$

I just did this in class today using @IstvánZachar's GillespieSSA function from this answer. Load that, then:

ClearAll[n];
reactions = {n -> 2 n, n -> Null};
b0 = 3;
d0 = 2;
rates = {b0, d0};
init = <|n -> 10|>;

tmax = 1;

sto = GillespieSSA[reactions, init, rates, {0, tmax}];
ListLinePlot[sto, InterpolationOrder -> 0, PlotRange -> {0, All}]

Mathematica graphics

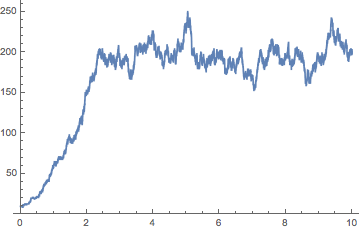
For fun, here's a version with density-dependent mortality:

ClearAll[n];
reactions = {n -> 2 n, n -> Null, 2 n -> Null};
b0 = 3;
d0 = 1;
d1 = 0.01;
rates = {b0, d0, d1};
init = <|n -> 10|>;

tmax = 10;

sto = GillespieSSA[reactions, init, rates, {0, tmax}];
ListLinePlot[sto, InterpolationOrder -> 0, PlotRange -> {0, All}]

Mathematica graphics

$\endgroup$
2
  • $\begingroup$ Thanks Chris. I saw that fabulous implementation, but it is too advanced for me. I can't follow some part of the code. So I decided to make my own code to understand to process. $\endgroup$ Commented Oct 20, 2017 at 22:16
  • $\begingroup$ Nice application Chris! Thanks for the mention! $\endgroup$ Commented Oct 21, 2017 at 7:07
1
$\begingroup$

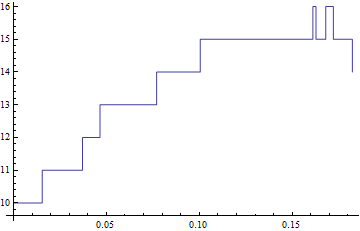
I fixed it. If should be If[Δt1 < Δt2, # + 1, # - 1]

birthDeath[λ_, μ_, initialPopulation_, numOfReaction_] :=     
 NestList[(
    Δt1 =  RandomVariate[ExponentialDistribution[λ  #]];
    Δt2 = RandomVariate[ExponentialDistribution[μ #]]; 
    If[Δt1 < Δt2, # + 1, # - 1]) &,  initialPopulation, numOfReaction]

birthDeath[3, 1, 10, 2]
$\endgroup$
1
  • $\begingroup$ How can I store $ \Delta t=Min[ \Delta t_1, \Delta t_2] $ so that I can plot time vs population $\endgroup$ Commented Oct 19, 2017 at 19:34
1
$\begingroup$

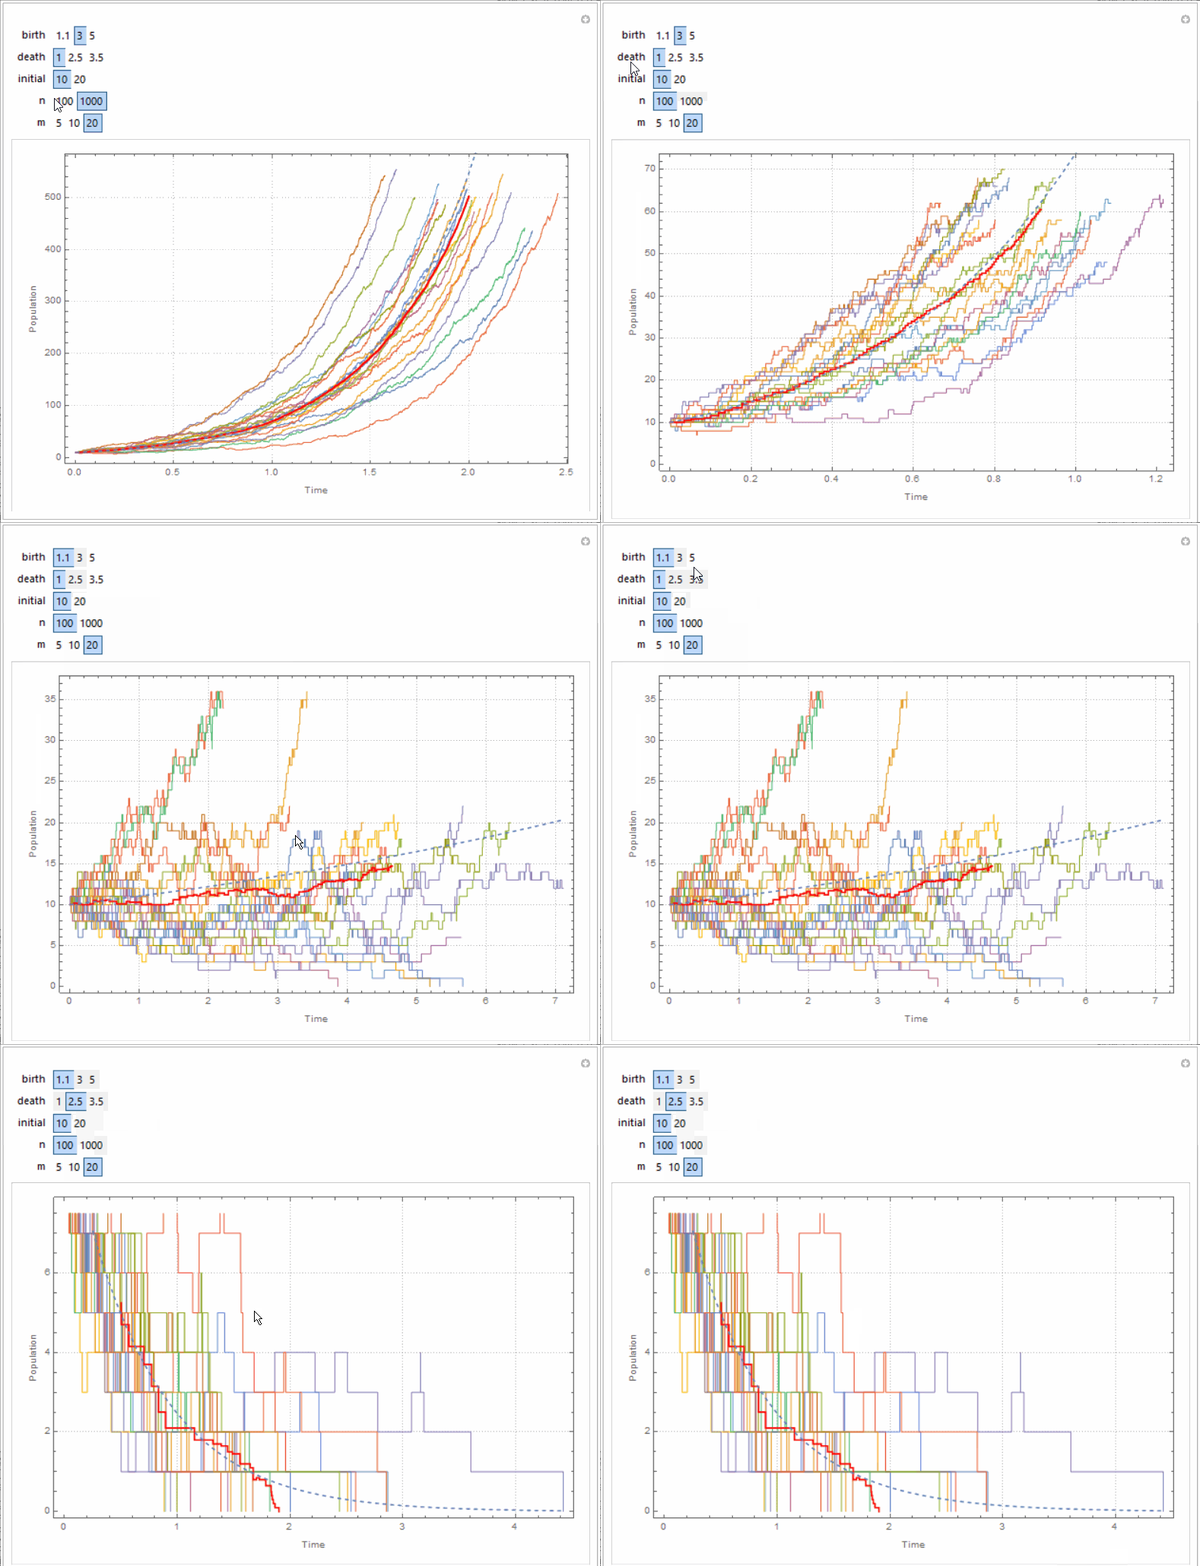
Just to "automate":

f[b_, d_, n0_, n_] := 
 NestList[Function[u, 
   If[u[[2]] == 0, u, 
    u + {Min[#1, #2], Sign[#2 - #1]} & @@ {RandomVariate[
       ExponentialDistribution[b u[[2]]]], 
      RandomVariate[ExponentialDistribution[d u[[2]]]]}]], {0, n0}, n]
vis[b_, d_, n0_, n_, m_] := 
 Module[{tab = Table[f[b, d, n0, n], m], mx},
  mx = Max[(Join @@ tab)[[All, 1]]];
  Show[ListStepPlot[tab, 
    PlotStyle -> Directive[AbsoluteThickness[0.2]], Frame -> True, 
    PlotTheme -> "Detailed", FrameLabel -> {"Time", "Population"}, 
    ImageSize -> Large], ListStepPlot[Mean@tab, PlotStyle -> Red], 
   Plot[n0 Exp[(b - d) t], {t, 0, mx}, PlotStyle -> Dashed]]]

So,

Manipulate[
 vis[birth, death, initial, n, 
  m], {birth, {1.1, 3, 5}}, {death, {1, 2.5, 3.5}}, {initial, {10, 
   20}}, {n, {100, 1000}}, {m, {5, 10, 20}}]

enter image description here

$\endgroup$

Your Answer

By clicking “Post Your Answer”, you agree to our terms of service and acknowledge you have read our privacy policy.

Not the answer you're looking for? Browse other questions tagged or ask your own question.