rearranged code to fix potential bug
Source Link
Chris K
  • 20.4k
  • 3
  • 39
  • 75

I just did this in class today using @IstvánZachar's GillespieSSA function from this answer. Load that, then:

ClearAll[n];
reactions = {n -> 2 n, n -> Null};
rates = {b0, d0};
b0 = 3;
d0 = 2;
rates = {b0, d0};
init = <|n -> 10|>;

tmax = 1;

sto = GillespieSSA[reactions, init, rates, {0, tmax}];
ListLinePlot[sto, InterpolationOrder -> 0, PlotRange -> {0, All}]
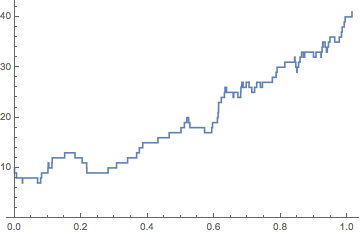
Mathematica graphics

For fun, here's a version with density-dependent mortality:

ClearAll[n];
reactions = {n -> 2 n, n -> Null, 2 n -> Null};
rates = {b0, d0, d1};
b0 = 3;
d0 = 1;
d1 = 0.01;
rates = {b0, d0, d1};
init = <|n -> 10|>;

tmax = 10;

sto = GillespieSSA[reactions, init, rates, {0, tmax}];
ListLinePlot[sto, InterpolationOrder -> 0, PlotRange -> {0, All}]
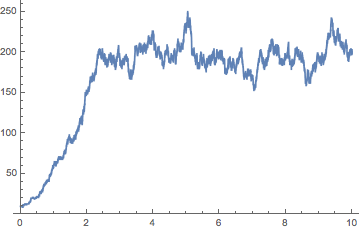
Mathematica graphics

I just did this in class today using @IstvánZachar's GillespieSSA function from this answer. Load that, then:

ClearAll[n];
reactions = {n -> 2 n, n -> Null};
rates = {b0, d0};
b0 = 3;
d0 = 2;
init = <|n -> 10|>;

tmax = 1;

sto = GillespieSSA[reactions, init, rates, {0, tmax}];
ListLinePlot[sto, InterpolationOrder -> 0, PlotRange -> {0, All}]

Mathematica graphics

For fun, here's a version with density-dependent mortality:

ClearAll[n];
reactions = {n -> 2 n, n -> Null, 2 n -> Null};
rates = {b0, d0, d1};
b0 = 3;
d0 = 1;
d1 = 0.01;
init = <|n -> 10|>;

tmax = 10;

sto = GillespieSSA[reactions, init, rates, {0, tmax}];
ListLinePlot[sto, InterpolationOrder -> 0, PlotRange -> {0, All}]

Mathematica graphics

I just did this in class today using @IstvánZachar's GillespieSSA function from this answer. Load that, then:

ClearAll[n];
reactions = {n -> 2 n, n -> Null};
b0 = 3;
d0 = 2;
rates = {b0, d0};
init = <|n -> 10|>;

tmax = 1;

sto = GillespieSSA[reactions, init, rates, {0, tmax}];
ListLinePlot[sto, InterpolationOrder -> 0, PlotRange -> {0, All}]

Mathematica graphics

For fun, here's a version with density-dependent mortality:

ClearAll[n];
reactions = {n -> 2 n, n -> Null, 2 n -> Null};
b0 = 3;
d0 = 1;
d1 = 0.01;
rates = {b0, d0, d1};
init = <|n -> 10|>;

tmax = 10;

sto = GillespieSSA[reactions, init, rates, {0, tmax}];
ListLinePlot[sto, InterpolationOrder -> 0, PlotRange -> {0, All}]

Mathematica graphics

added ClearAll[n];
Source Link
Chris K
  • 20.4k
  • 3
  • 39
  • 75

I just did this in class today using @IstvánZachar's GillespieSSA function from this answer. Load that, then:

ClearAll[n];
reactions = {n -> 2 n, n -> Null};
rates = {b0, d0};
b0 = 3;
d0 = 2;
init = <|n -> 10|>;

tmax = 1;

sto = GillespieSSA[reactions, init, rates, {0, tmax}];
ListLinePlot[sto, InterpolationOrder -> 0, PlotRange -> {0, All}]

Mathematica graphics

For fun, here's a version with density-dependent mortality:

ClearAll[n];
reactions = {n -> 2 n, n -> Null, 2 n -> Null};
rates = {b0, d0, d1};
b0 = 3;
d0 = 1;
d1 = 0.01;
init = <|n -> 10|>;

tmax = 10;

sto = GillespieSSA[reactions, init, rates, {0, tmax}];
ListLinePlot[sto, InterpolationOrder -> 0, PlotRange -> {0, All}]

Mathematica graphics

I just did this in class today using @IstvánZachar's GillespieSSA function from this answer. Load that, then:

reactions = {n -> 2 n, n -> Null};
rates = {b0, d0};
b0 = 3;
d0 = 2;
init = <|n -> 10|>;

tmax = 1;

sto = GillespieSSA[reactions, init, rates, {0, tmax}];
ListLinePlot[sto, InterpolationOrder -> 0, PlotRange -> {0, All}]

Mathematica graphics

For fun, here's a version with density-dependent mortality:

reactions = {n -> 2 n, n -> Null, 2 n -> Null};
rates = {b0, d0, d1};
b0 = 3;
d0 = 1;
d1 = 0.01;
init = <|n -> 10|>;

tmax = 10;

sto = GillespieSSA[reactions, init, rates, {0, tmax}];
ListLinePlot[sto, InterpolationOrder -> 0, PlotRange -> {0, All}]

Mathematica graphics

I just did this in class today using @IstvánZachar's GillespieSSA function from this answer. Load that, then:

ClearAll[n];
reactions = {n -> 2 n, n -> Null};
rates = {b0, d0};
b0 = 3;
d0 = 2;
init = <|n -> 10|>;

tmax = 1;

sto = GillespieSSA[reactions, init, rates, {0, tmax}];
ListLinePlot[sto, InterpolationOrder -> 0, PlotRange -> {0, All}]

Mathematica graphics

For fun, here's a version with density-dependent mortality:

ClearAll[n];
reactions = {n -> 2 n, n -> Null, 2 n -> Null};
rates = {b0, d0, d1};
b0 = 3;
d0 = 1;
d1 = 0.01;
init = <|n -> 10|>;

tmax = 10;

sto = GillespieSSA[reactions, init, rates, {0, tmax}];
ListLinePlot[sto, InterpolationOrder -> 0, PlotRange -> {0, All}]

Mathematica graphics

Source Link
Chris K
  • 20.4k
  • 3
  • 39
  • 75

I just did this in class today using @IstvánZachar's GillespieSSA function from this answer. Load that, then:

reactions = {n -> 2 n, n -> Null};
rates = {b0, d0};
b0 = 3;
d0 = 2;
init = <|n -> 10|>;

tmax = 1;

sto = GillespieSSA[reactions, init, rates, {0, tmax}];
ListLinePlot[sto, InterpolationOrder -> 0, PlotRange -> {0, All}]

Mathematica graphics

For fun, here's a version with density-dependent mortality:

reactions = {n -> 2 n, n -> Null, 2 n -> Null};
rates = {b0, d0, d1};
b0 = 3;
d0 = 1;
d1 = 0.01;
init = <|n -> 10|>;

tmax = 10;

sto = GillespieSSA[reactions, init, rates, {0, tmax}];
ListLinePlot[sto, InterpolationOrder -> 0, PlotRange -> {0, All}]

Mathematica graphics