0
$\begingroup$

I want to label my plot. I have done some part of it till now:

a22 = Plot[{3 x}, {x, 0, 3}, AxesOrigin -> {0, 0}, PlotLegends -> {"\!\(\*SubscriptBox[\(x\), \(C\)]< \* \FractionBox[SubscriptBox[ \(f +b\), \(m\)], \(yu\)]\)"}, Exclusions -> 3/(x - 1) == 0, PlotStyle -> {Thickness[0.006], {Orange, Dashing[None]}}, Ticks -> None]

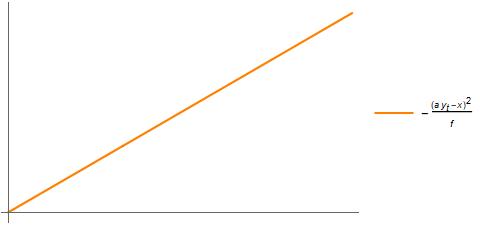
But I want to write second power of numerator in the output. Does anyone know how can I change numerator with second power of it?

$\endgroup$
4
  • $\begingroup$ Can you write down expression that you want to put in plot legend? $\endgroup$
    – ercegovac
    Commented Sep 28, 2017 at 19:59
  • $\begingroup$ -(-x+a y_t)^2/f it is what I need. Is it clear? @ercegovac $\endgroup$ Commented Sep 28, 2017 at 20:03
  • $\begingroup$ I prefer the fraction be written in with horizontal line instead of /. @ercegovac $\endgroup$ Commented Sep 28, 2017 at 20:07
  • 1
    $\begingroup$ Take a look at this - you can simply enter the expression the way you want to see it in the legend $\endgroup$
    – Lukas Lang
    Commented Sep 28, 2017 at 20:16

1 Answer 1

1
$\begingroup$

This?

Plot[{3 x}, {x, 0, 3}, AxesOrigin -> {0, 0}, 
 PlotLegends -> {TraditionalForm[-(-x + a Subscript[y, t])^2/f]}, 
 Exclusions -> 3/(x - 1) == 0, 
 PlotStyle -> {Thickness[0.006], {Orange, Dashing[None]}}, 
 Ticks -> None]

enter image description here

Mathematica has multiple forms of presenting data. Check this tutorial to understand various forms.

$\endgroup$
1
  • $\begingroup$ TraditionalForm uses a lot of ad-hoc rules and heuristics in attempt to present data in the way traditional to mathematics. $\endgroup$
    – ercegovac
    Commented Sep 28, 2017 at 20:17

Your Answer

By clicking “Post Your Answer”, you agree to our terms of service and acknowledge you have read our privacy policy.

Not the answer you're looking for? Browse other questions tagged or ask your own question.