5
$\begingroup$

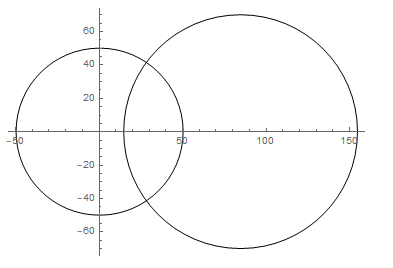
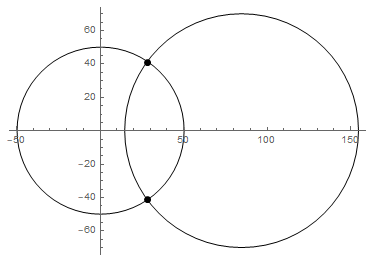
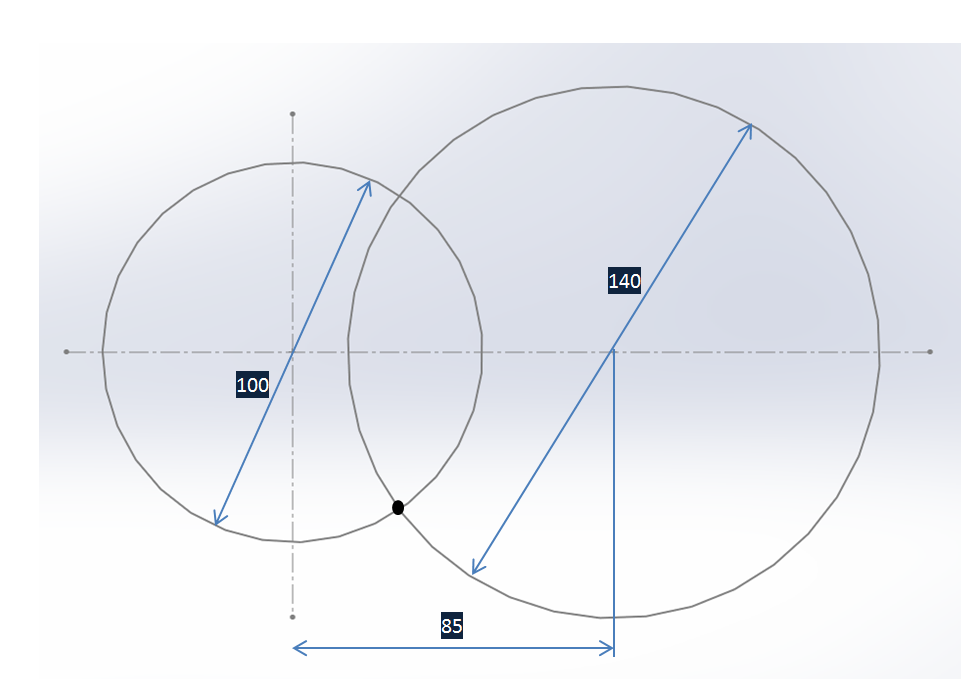
I would like to generate the two circle graphic shown below:

enter image description here

As the first step, I want to make the first circle with center (0,0) and diameter of 100 mm by using the program that follows:

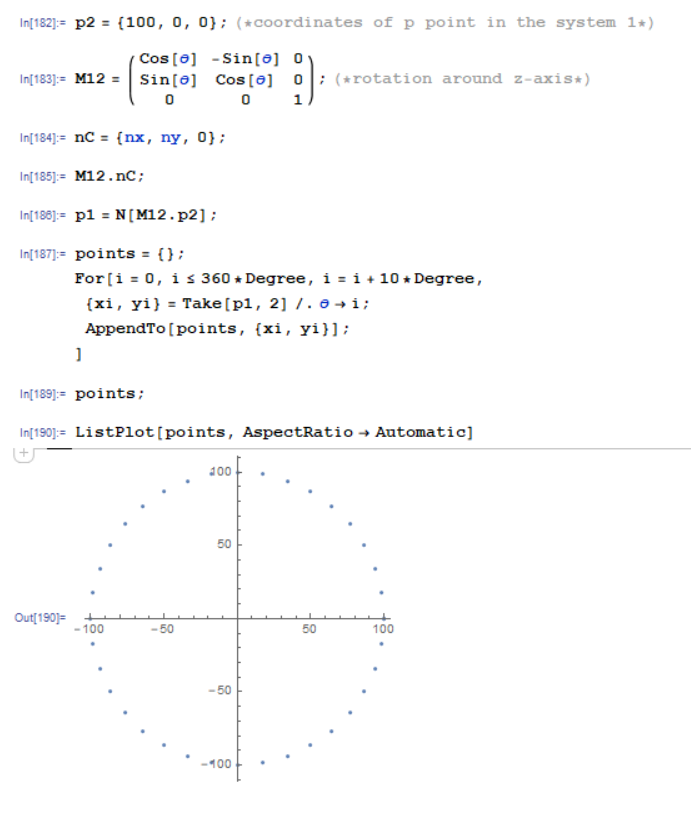
enter image description here

But, I feel confused when I will make second circle with center of distance 85 mm and diameter of 140 mm.

My questions:

  1. Is there another better technique to make the first circle and the second circle? Also, please advice me how to get points in both circles?

  2. How to find the intersection point between the first circle and the second circle?
$\endgroup$
2
  • 3
    $\begingroup$ Can you use RegionIntersection[Circle[{0, 0}, 50], Circle[{85, 0}, 70]] to find the intersection, and then Graphics[{Circle[{0, 0}, 50], Circle[{85, 0}, 70], PointSize[Large], RegionIntersection[Circle[{0, 0}, 50], Circle[{85, 0}, 70]]}] to plot it? $\endgroup$
    – Carl Woll
    Commented Aug 29, 2017 at 2:17
  • 1
    $\begingroup$ RegionIntersection was introduced in v10. For earlier versions see Circle-Circle Intersection in Wolfram MathWorld $\endgroup$
    – Bob Hanlon
    Commented Aug 29, 2017 at 3:53

5 Answers 5

9
$\begingroup$
rg1 = Circle[{0, 0}, 2];
rg2 = Circle[{0., 1}, 1.5];
pts=RegionIntersection[rg1, rg2] 
RegionPlot[{rg1, rg2}, AspectRatio -> Automatic, 
 Epilog -> {PointSize -> Large, pts}]

Point[{{-1.45237, 1.375}, {1.45237, 1.375}}]

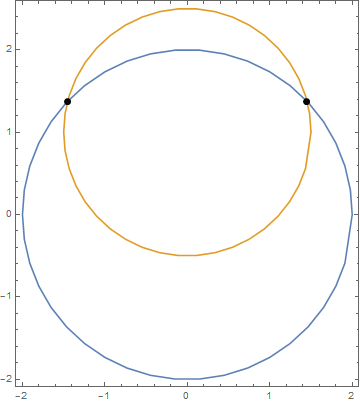
enter image description here

$\endgroup$
8
$\begingroup$

1.

You can use the Circle Expression to create your circles instead of plotting points. Then poke the circle expressions into Graphics to create the plot. (Since you want axes, we set the Axis option to True)

circle1 = Circle[{0, 0}, 50];
circle2 = Circle[{85, 0}, 70];
Graphics[{circle1, circle2}, Axes -> True]

Two outlines of circles intersecting each other overlaid onto a pair of axes

2.

To find the intersection of the circle we can use the formulas for the two circles and the solve function

equation1 = x^2 + y^2 == 50^2;
equation2 = (x - 85)^2 + y^2 == 70^2;
solutions = Solve[{equation1, equation2}]

The solutions to the above formula as a list of lists of rules

To convert that into a nice set of coordinates, we use Part which can be written as [[ ]]. It is similar to indexing in other programming languages.

coords = solutions[[ All, All, 2]]

Then we generate points using Point and Map (which can also be written as /@) to generate Point expressions to insert into the Graphics function. Map (when written as /@) wraps every item of the top level expression on the right hand side with the function supplied on the left hand side.

points = Point /@ coords

The we join our points with the circles Join to feed to the Graphics function similar to what we did in part 1

Graphics[Join[{circle1, circle2}, points], Axes -> True]

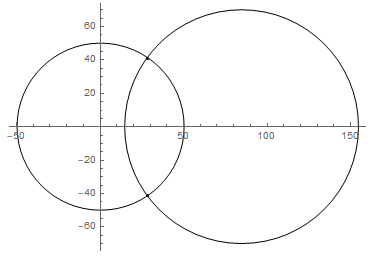
Two circles intersecting with their intersections highlighted with little black dots

To make the points easier to see, we can make them larger with the PointSize Graphics directive

Graphics[Join[{PointSize[Large], circle1, circle2}, points], Axes -> True]

The same two circles intersecting, with their intersections highlighted with large black dots

$\endgroup$
3
  • 2
    $\begingroup$ Your Circle expressions have the wrong radius; they should be Circle[{0, 0}, 50]; Circle[{85, 0}, 70];. $\endgroup$
    – MarcoB
    Commented Aug 29, 2017 at 3:19
  • $\begingroup$ @The Square Cow, technically it works. and for question no. 1, how to get points in circle1 and circle2? as on my previous program, e.g. circle1= {{100., 0.}, {98.4808, 17.3648}, {93.9693, 34.202}, ..., {98.4808, -17.3648}, {100., 0.}}. $\endgroup$
    – Mukidi Lee
    Commented Aug 29, 2017 at 3:26
  • $\begingroup$ @MarcoB I fixed the radius. I noticed that while writing the post but forgot to copy and past the new code to match the updated picture. That is why the diagrams have the correct radius but the code didn't. Thanks for the reminder $\endgroup$ Commented Aug 29, 2017 at 16:43
3
$\begingroup$

Just for illustrative purposes:

i[{c1_, r1_}, {c2_, r2_}] := 
 Module[{r}, 
  If[c1 == c2 && r1 == r2, {}, 
   r = {x, y} /. 
     Solve[{({x, y} - c1).({x, y} - c1) == 
        r1^2, ({x, y} - c2).({x, y} - c2) == r2^2}, {x, y}, Reals]; 
   If[r === {x, y}, {}, r]]]
f[{c1_, r1_}, {c2_, r2_}, lim_] :=
 Module[{sol = Quiet@i[{c1, r1}, {c2, r2}]}, 
  Graphics[{Circle[c1, r1], Circle[c2, r2], Red, PointSize[0.02], 
    Point[sol], Text[c1, c1], Text[c2, c2], Blue,
    Arrow[{c1, c1 + r1 {-1/Sqrt[2], 1/Sqrt[2]}}], 
    Text[Framed[r1, Background -> White], 
     c1 + r1 {-1/Sqrt[2], 1/Sqrt[2]}/2],
    Arrow[{c2, c2 + r2 {1/Sqrt[2], 1/Sqrt[2]}}], 
    Text[Framed[r2, Background -> White], 
     c2 + r2 {1/Sqrt[2], 1/Sqrt[2]}/2],
    Text[#, #, {-1.5, 0}] & /@ sol
    }, PlotRange -> ConstantArray[{-lim, lim}, 2], Axes -> True, 
   GridLines -> Transpose[{c1, c2}]]]
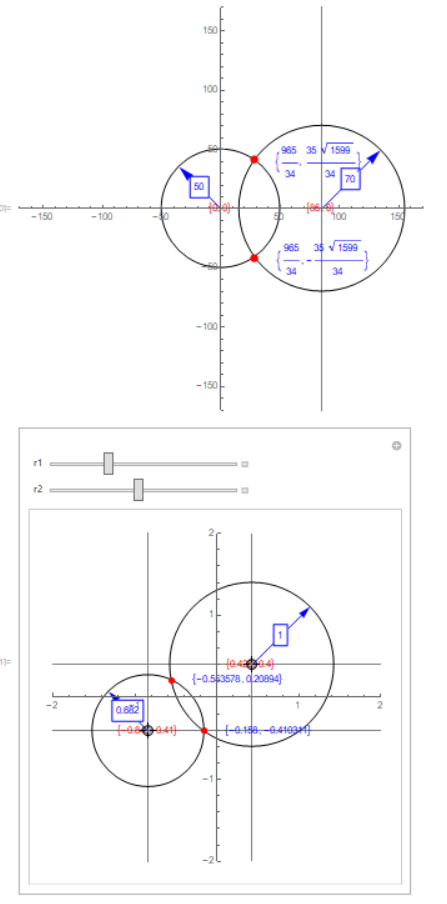
f[{{0, 0}, 50}, {{85, 0}, 70}, 170]
Manipulate[
 f[{c1, r1}, {c2, r2}, 2], {c1, {-1, -1}, {1, 1}, 
  Locator}, {{c2, {0, 0}}, {-1, -1}, {1, 1}, Locator}, {r1, 0.1, 
  2}, {{r2, 1}, 0.1, 2}]

enter image description here

$\endgroup$
1
$\begingroup$

I would like to add the alternative answer for you.

C1 = Table[{50*Cos[\[Theta]*Degree], 
 50*Sin[\[Theta]*Degree]}, {\[Theta], 1, 360}] // N;
C2 = Table[{70*Cos[\[Theta]*Degree] + 85, 
 70*Sin[\[Theta]*Degree]}, {\[Theta], 1, 360}] // N;

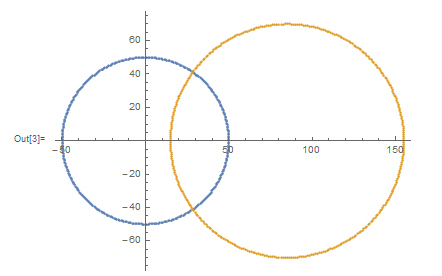
To show in graphic, you can use:

ListPlot[{C1, C2}, AspectRatio -> Automatic]

enter image description here

For the intersection, you can follow program below:

equation1 = x^2 + y^2 == 50^2;
equation2 = (x - 85)^2 + y^2 == 70^2;
solutionMax = Solve[{equation1, equation2 && y > 0}];
solutionMin = Solve[{equation1, equation2 && y < 0}];

coordMax = solutionMax[[All, All, 2]]
coordMin = solutionMin[[All, All, 2]]
{{965/34, (35 Sqrt[1599])/34}}
{{965/34, -((35 Sqrt[1599])/34)}}
$\endgroup$
0
0
$\begingroup$

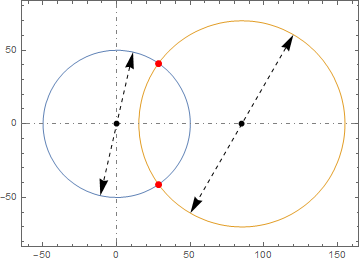
It is straightforward to do it with Region functionality. However, if equations are the starting point, then the following could be a possibility.

Clear["Global`*"]
eq1 = x^2 + y^2 - 50^2;
eq2 = (x - 85)^2 + y^2 - 70^2;

etyp = (-h + x)^2 + (-k + y)^2 == r^2;

sol1 = SolveAlways[ eq1 == Subtract @@ etyp, {x, y}];
sol2 = SolveAlways[ eq2 == Subtract @@ etyp, {x, y}];

c1 = Circle[{h, k}, r] /. First@Pick[sol1, r /. allsol // UnitStep, 1]
c2 = Circle[{h, k}, r] /. First@Pick[sol2, r /. allsol // UnitStep, 1]

Circle[{0, 0}, 50]

Circle[{85, 0}, 70]

ContourPlot[{eq1, eq2}
 , {x, -60, 160}, {y, -80, 80}
 , MeshStyle -> Directive[PointSize[Large], Red]
 , Mesh -> {{0}}
 , MeshFunctions -> {Function[{x, y}, eq1], Function[{x, y}, eq2]}
 , AspectRatio -> Automatic
 , Axes -> True
 , AxesStyle -> {{Gray, DotDashed}, {Gray, DotDashed}}
 , Epilog -> {
   Black, AbsolutePointSize[6]
   , Point@{RegionCentroid@c1
     , RegionCentroid@c2}
   
   , {Dashed, Arrowheads[{-.05, .05}]
    , Arrow[CirclePoints[{Last@c1, π/2 - π/14}, 2]]}
   
   , {Dashed, Arrowheads[{-.05, .05}]
    , GeometricTransformation[
     Arrow[CirclePoints[{Last@c2, π/3}, 2], 0.01]
     , TranslationTransform[First@c2]
     ] (* end of GeometricTransformation *)
    }
   } (* end of Epilog *)
 ]

enter image description here

$\endgroup$

Your Answer

By clicking “Post Your Answer”, you agree to our terms of service and acknowledge you have read our privacy policy.

Not the answer you're looking for? Browse other questions tagged or ask your own question.