3
$\begingroup$

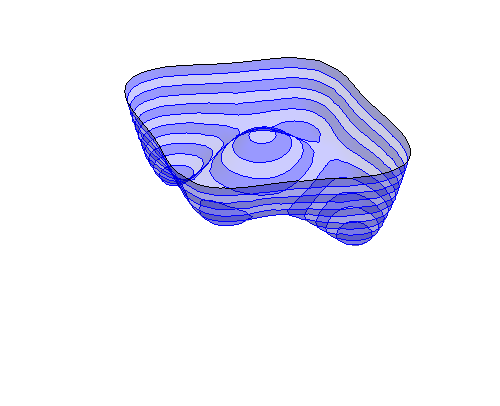
I need to import the following to eps so that I can put it into my TeX file. The problem is two-fold: the exported file looks terrible (unlike the Mathematica output), and secondly, the file size is huge (over 1 MB), making it take forever to render in the pdf file.

potential1 = 
  Plot3D[-3600. h^2 + 0.02974 h^4 - 5391.90 s^2 + 0.275 h^2 s^2 + 0.125 s^4, {h, -400, 400}, 
    {s, -300, 300}, PlotRange -> {-1.4*10^8, 2*10^7}, ClippingStyle -> None, 
    MeshFunctions -> {#3 &}, Mesh -> 10,  MeshStyle -> {AbsoluteThickness[1], Blue}, 
    Lighting -> "Neutral", MeshShading -> {{Opacity[.4], Blue}, {Opacity[.2], Blue}}, 
    Boxed -> False, Axes -> False]
Export["pot1.eps", potential1, ImageSize -> 500]

The Mathematica output (in png) is enter image description here. I can't use png in LaTeX. I tried to export in pdf, but I'm running into an error: "Cannot determine size of graphic in pot1.pdf (no BoundingBox)."
$\endgroup$
1
  • $\begingroup$ I've never had problems with using png in LaTeX. It may be due to my use of graphicx and pdflatex. $\endgroup$
    – rcollyer
    Commented Nov 19, 2012 at 2:14

1 Answer 1

7
$\begingroup$

Maybe you have an older version of $\LaTeX$ installed that doesn't play nicely with PDF of PNG. So you need to export as EPS, encapsulated postscript.

The answer is the same as for this question: Exporting BarChart3D as PDF produces artefacts - I'll repeat it here because you're asking about EPS export, and that question was about PDF export:

Map[SetOptions[#, 
    Prolog -> {{EdgeForm[], Texture[{{{0, 0, 0, 0}}}], 
       Polygon[#, VertexTextureCoordinates -> #] &[{{0, 0}, {1, 
          0}, {1, 1}}]}}] &, {Graphics3D, ContourPlot3D, 
   ListContourPlot3D, ListPlot3D, Plot3D, ListSurfacePlot3D, 
   ListVectorPlot3D, ParametricPlot3D, RegionPlot3D, RevolutionPlot3D,
    SphericalPlot3D, VectorPlot3D, BarChart3D}];

potential1 = 
 Plot3D[-3600. h^2 + 0.02974 h^4 - 5391.90 s^2 + 0.275 h^2 s^2 + 
   0.125 s^4, {h, -400, 400}, {s, -300, 300}, 
  PlotRange -> {-1.4*10^8, 2*10^7}, ClippingStyle -> None, 
  MeshFunctions -> {#3 &}, Mesh -> 10, 
  MeshStyle -> {AbsoluteThickness[1], Blue}, Lighting -> "Neutral", 
  MeshShading -> {{Opacity[.4], Blue}, {Opacity[.2], Blue}}, 
  Boxed -> False, Axes -> False]
Export["pot1.eps", potential1, ImageSize -> 500]

The first cell is there to add a Prolog to all your 3D plots that forces the conversion to bitmap upon export. Since this also applies to EPS, you'll get a bitmap wrapped in an EPS container that can be included in $\LaTeX$. The resulting EPS will look just like what you have posted.

Also note that you have to execute the first cell only one time, and all subsequent plots will look fine when exported to EPS or PDF.

$\endgroup$

Your Answer

By clicking “Post Your Answer”, you agree to our terms of service and acknowledge you have read our privacy policy.

Not the answer you're looking for? Browse other questions tagged or ask your own question.