Here are my data points:
59.51 -59.3642
58.9944 -58.8079
58.4836 -58.2471
57.9778 -57.6819
57.4769 -57.1122
56.981 -56.5383
56.4901 -55.96
56.0043 -55.3775
55.5236 -54.7907
55.048 -54.1998
54.5777 -53.6048
54.1125 -53.0056
53.6525 -52.4025
53.1979 -51.7953
52.7486 -51.1842
52.3046 -50.5692
51.866 -49.9503
51.4328 -49.3277
51.0051 -48.7013
50.5828 -48.0712
50.4206 -47.8259
50.0013 -48.2641
49.5782 -48.6986
49.1514 -49.1294
48.7208 -49.5564
48.2865 -49.9797
47.8485 -50.3992
47.4069 -50.8148
46.9616 -51.2266
46.5128 -51.6344
46.0604 -52.0384
45.6046 -52.4383
45.1452 -52.8343
44.6824 -53.2263
44.2163 -53.6141
43.7467 -53.998
43.2738 -54.3777
42.7977 -54.7532
42.3182 -55.1246
41.8356 -55.4918
41.3497 -55.8548
40.8607 -56.2135
40.3686 -56.5679
39.8734 -56.918
39.3752 -57.2638
38.874 -57.6053
38.3698 -57.9423
37.8627 -58.2749
37.3528 -58.6031
36.8399 -58.9269
36.3243 -59.2461
35.8059 -59.5608
35.2848 -59.871
34.761 -60.1767
34.2345 -60.4777
33.7055 -60.7741
33.1738 -61.066
32.6397 -61.3531
32.103 -61.6356
31.5639 -61.9134
31.0224 -62.1865
30.4786 -62.4549
29.9324 -62.7185
29.384 -62.9773
28.8333 -63.2313
28.2804 -63.4805
27.7253 -63.7249
27.1682 -63.9644
26.609 -64.1991
26.0477 -64.4288
25.4845 -64.6537
24.9193 -64.8736
24.3522 -65.0886
23.7833 -65.2986
23.2126 -65.5037
22.6401 -65.7037
22.0658 -65.8988
21.4899 -66.0889
20.9124 -66.2739
20.3333 -66.4538
19.7526 -66.6288
19.1704 -66.7986
18.5867 -66.9633
18.0017 -67.123
17.4152 -67.2775
16.8275 -67.4269
16.2384 -67.5712
15.6481 -67.7103
15.0567 -67.8443
14.464 -67.9731
13.8703 -68.0968
13.2755 -68.2152
12.6798 -68.3285
12.083 -68.4365
11.4853 -68.5393
10.8868 -68.637
10.2874 -68.7294
9.68725 -68.8165
9.08635 -68.8984
8.48476 -68.9751
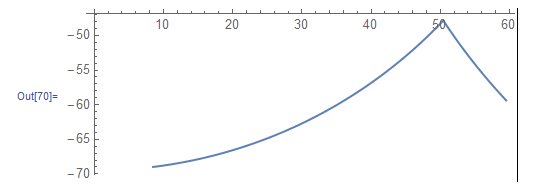
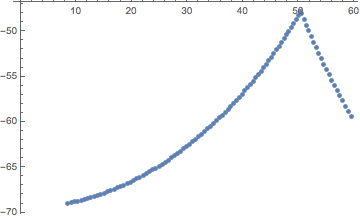
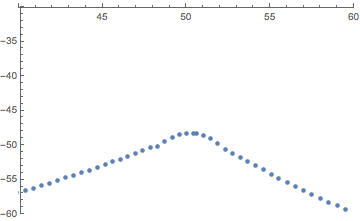
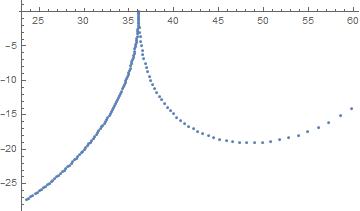
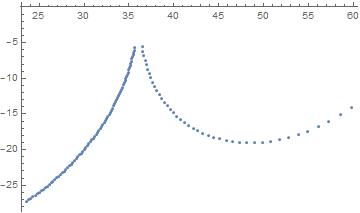
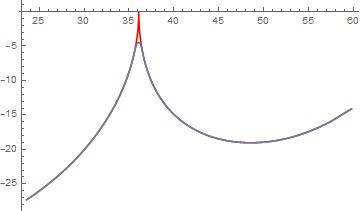
I plotted these point in Mathematica.
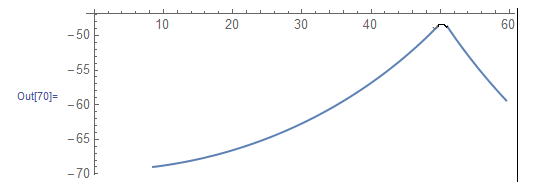
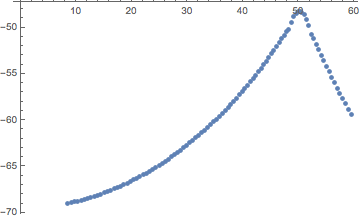
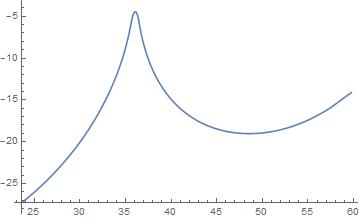
The plot shows a cusp. I would like to modify the plot to round off the cusp.
How can I do this in Mathematica?

{x1, y1, x2, y2, ...}. You should edit the post and format the data so that it is a valid Mathematica list that will plot correctly without having to edit it. $\endgroup$