1
$\begingroup$

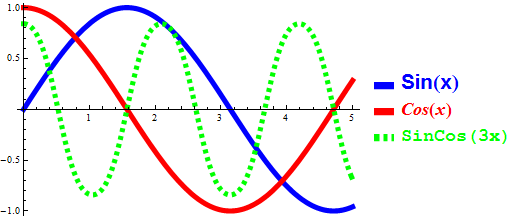
How can I access the features of LegendLines (thickness, color, dashed) and LegendLables (Fontsize, FontFamily, FontColor) in the same legend column?

I manage to change either of them, but not both together.

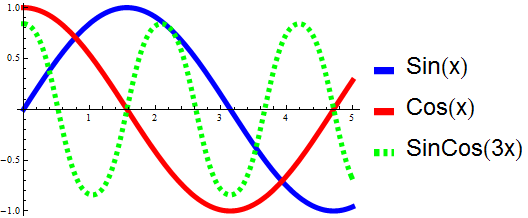
In this example I changed the parameters of LegendLables (PlotLegends) but I do not know how to make the LegendLines thicker:

Plot[{Sin[x], Cos[x], Sin[Cos[3 x]]}, {x, 0, 5}, 
PlotStyle -> {Directive[Blue, Thickness[0.015]], Directive[Red, Thickness[0.015]], Directive[Green, Thickness[0.015], Dashed]}, 
PlotLegends -> {Style["Sin(x)", Blue, Bold, 21, FontFamily -> "Helvetica"], Style["Cos(x)", Red, Bold, 18, FontFamily -> "Times", Italic], Style["SinCos(3x)", Green, Bold, 18, FontFamily -> "Courier"]}]

enter image description here

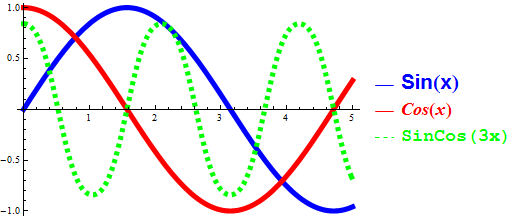
In this example I changed the parameters of LegendLines but I do not know how to color the LegendLables with different colors and their types.

Plot[{Sin[x], Cos[x], Sin[Cos[3 x]]}, {x, 0, 5}, 
PlotStyle -> {Directive[Blue, Thickness[0.015]], Directive[Red, Thickness[0.015]], Directive[Green, Thickness[0.015], Dashed]},  
PlotLegends -> LineLegend[{Directive[Blue, Thickness[0.4]], Directive[Red, Thickness[0.4]], Directive[Green, Thickness[0.4], Dashed]}, {"Sin(x)", "Cos(x)", "SinCos(3x)"}, LabelStyle -> Directive[Large, FontFamily -> "Helvetica"]]]

enter image description here

$\endgroup$
2
  • 1
    $\begingroup$ Does PlotLegends -> LineLegend[{Directive[Blue, Thickness[0.4]], Directive[Red, Thickness[0.4]], Directive[Green, Thickness[0.4], Dashed]}, {Style["Sin(x)", Blue, Thick, Bold, 21, FontFamily -> "Helvetica"], Style["Cos(x)", Red, Bold, 18, FontFamily -> "Times", Italic], Style["SinCos(3x)", Green, Bold, 18, FontFamily -> "Courier"]}]] give what you need? $\endgroup$
    – kglr
    Commented May 23, 2017 at 22:55
  • $\begingroup$ @kglr, Thanks!!! it gives me what I need. The question is answered!!! $\endgroup$
    – surfAliq
    Commented May 24, 2017 at 11:21

1 Answer 1

3
$\begingroup$
Plot[{Sin[x], Cos[x], Sin[Cos[3 x]]}, {x, 0, 5}, 
 PlotStyle -> {Directive[Blue, Thickness[0.015]], 
   Directive[Red, Thickness[0.015]], Directive[Green, Thickness[0.015], Dashed]}, 
 PlotLegends ->  LineLegend[{Directive[Blue, Thickness[0.4]], 
    Directive[Red, Thickness[0.4]], Directive[Green, Thickness[0.4], Dashed]}, 
   {Style["Sin(x)", Blue, Thick, Bold, 21, FontFamily -> "Helvetica"], 
    Style["Cos(x)", Red, Bold, 18, FontFamily -> "Times", Italic], 
    Style["SinCos(3x)", Green, Bold, 18, FontFamily -> "Courier"]}]]

Mathematica graphics

$\endgroup$
7
  • $\begingroup$ I am using your method. How do I change the length of the lines in LineLegend? Does your post need updating; are there more features in more recent versions? Thanks $\endgroup$
    – Hugh
    Commented Nov 20, 2018 at 19:57
  • $\begingroup$ @Hugh, you can add the option LegendMarkerSize -> 30 to LineLegend. $\endgroup$
    – kglr
    Commented Nov 20, 2018 at 20:05
  • $\begingroup$ Thanks this works nicely. I have the legend items at the bottom of my plot Placed[...,Below] and now they have wrapped to more than one line. How do I prevent this? Thanks again. $\endgroup$
    – Hugh
    Commented Nov 20, 2018 at 20:08
  • $\begingroup$ @Hugh, add the option LegendLayout ->{"Row", 1} to LineLegend. $\endgroup$
    – kglr
    Commented Nov 20, 2018 at 20:12
  • $\begingroup$ Brilliant thanks. Where can I find all these options? I don't want to keep asking you! $\endgroup$
    – Hugh
    Commented Nov 20, 2018 at 20:13

Your Answer

By clicking “Post Your Answer”, you agree to our terms of service and acknowledge you have read our privacy policy.

Not the answer you're looking for? Browse other questions tagged or ask your own question.