0
$\begingroup$

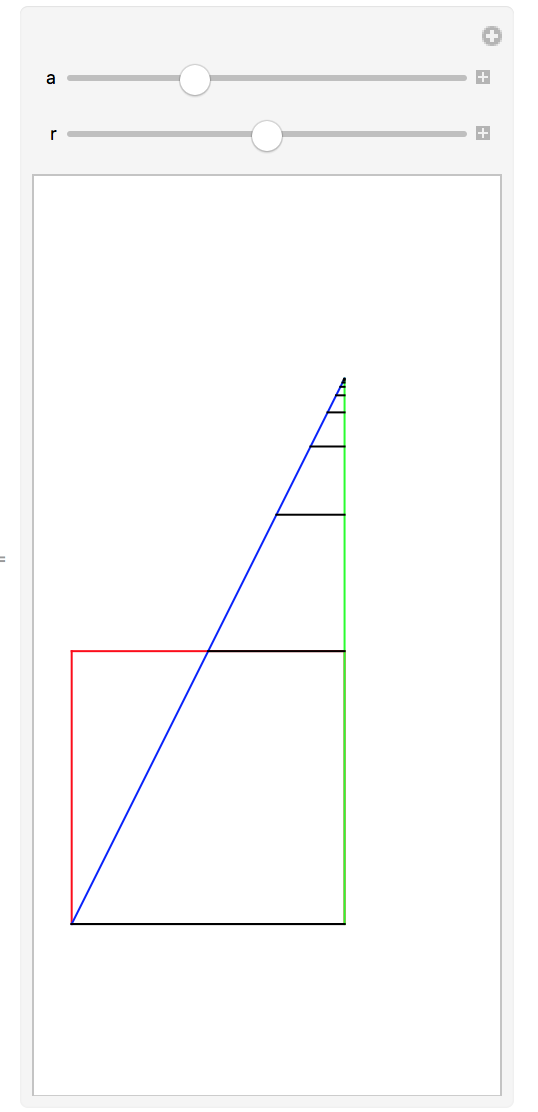
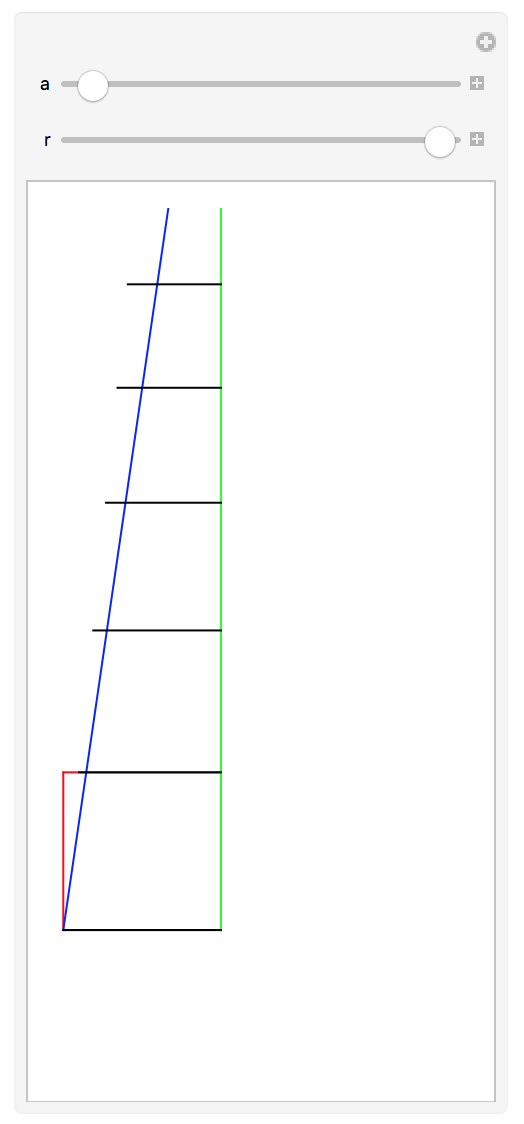
I attempted to graph the representation of the geometric series, everything works fine except when I increase "r" to a certain value(see figure 1 and 2 below), the horizontal lines begin to cross the diagonal line, therefore, making my model imperfect. Please help me to locate the bug mathematically.

enter image description here Figure 1

enter image description here Figure 2

Manipulate[Show[Graphics[{Red, Line[{{0, 0}, {0, a}}]}],
  (*the base square with side = a*)

  Graphics[{Red, Line[{{a, 0}, {a, a}}]}], 
  Graphics[{Red, Line[{{0, a}, {a, a}}]}], 
  Graphics[{Black, Line[{{0, 0}, {a, 0}}]}], 
  Graphics[{Black, Line[{{0, 0}, {a, 0}}]}],
  (*the vertical line*)

  Graphics[{Green, Line[{{a, 0}, {a, Sum[a r^i, {i, 0, 10}]}}]}],
  (*The diagonal line*)

  Graphics[{Blue, Line[{{0, 0}, {a, Sum[a r^i, {i, 0, 10}]}}]}],
  (*The horizontal lines*)

  Table[Graphics[{Black, 
     Line[{{a - 
         a r^i, (Sum[a r^b, {b, 0, i}] - 
          a r^i)}, {a, (Sum[a r^b, {b, 0, i}] - a r^i)}}]}], {i, 0, 
    10}],
  AxesLabel -> {"x", "y"}, PlotRange -> {-1, 5}], {a, 1, 4}, {r, 0.1, 
  0.9, 0.1}]
$\endgroup$

1 Answer 1

1
$\begingroup$

So if I understand correctly something like:

Manipulate[
 Show[Graphics[{Red, 
    Line[{{0, 0}, {0, a}}]}],(*the base square with side=a*)
  Graphics[{Red, Line[{{a, 0}, {a, a}}]}], 
  Graphics[{Red, Line[{{0, a}, {a, a}}]}], 
  Graphics[{Black, Line[{{0, 0}, {a, 0}}]}], 
  Graphics[{Black, Line[{{0, 0}, {a, 0}}]}],(*the vertical line*)
  Graphics[{Green, 
    Line[{{a, 0}, {a, Sum[a r^i, {i, 0, 10}]}}]}],(*The diagonal line*)
  Graphics[{Blue, 
    Line[{{0, 0}, {a, 
       Sum[a r^i, {i, 0, 10}]}}]}],(*The horizontal lines*)
  Table[Graphics[{Black,
     Line[{{(Sum[a r^b, {b, 0, i}] - a r^i)/(Sum[a r^i, {i, 0, 10}]/
         a), (Sum[a r^b, {b, 0, i}] - 
          a r^i)}, {a, (Sum[a r^b, {b, 0, i}] - a r^i)}}]}], {i, 0, 
    10}], AxesLabel -> {"x", "y"}, PlotRange -> {-1, 8}], {a, 1, 
  4}, {r, 0.1, 0.9, 0.1}]

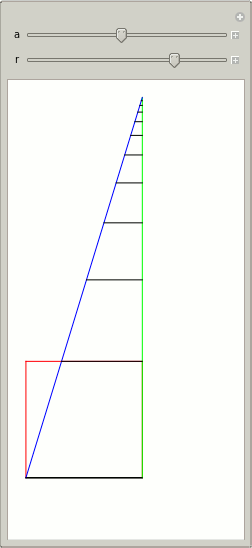
might help the black lines from crossing the blue line as r increases?

enter image description here

To elaborate a little the division is just based on the fact that we have a blue line from 0,0 to wherever. I just use the old line equation y=mx+c (we can drop the +c part) rearranged to y/m=x to give us the x coordinate of where a black line xcoord sits in relation to our blue line. It isn't brilliant (I'm sure there are better ways, plus there is probably a way more efficient way of writing what you are doing in Mathematica) but that is just quickly how I saw it :)

$\endgroup$
2
  • $\begingroup$ I sort of understand your code, but still trying to figure why the division you added worked, would you mind to elaborate a little bit? $\endgroup$
    – DSL
    Commented May 10, 2017 at 16:36
  • 1
    $\begingroup$ @Tmm see edited answer $\endgroup$
    – foxcode64
    Commented May 10, 2017 at 16:54

Your Answer

By clicking “Post Your Answer”, you agree to our terms of service and acknowledge you have read our privacy policy.

Not the answer you're looking for? Browse other questions tagged or ask your own question.