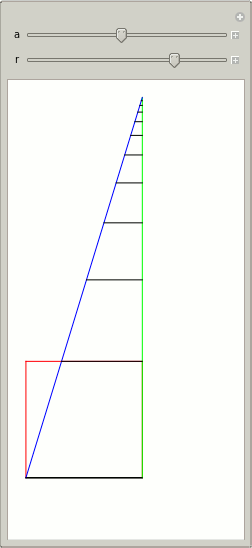
So if I understand correctly something like:
Manipulate[
 Show[Graphics[{Red,
    Line[{{0, 0}, {0, a}}]}],(*the base square with side=a*)
  Graphics[{Red, Line[{{a, 0}, {a, a}}]}],
  Graphics[{Red, Line[{{0, a}, {a, a}}]}],
  Graphics[{Black, Line[{{0, 0}, {a, 0}}]}],
  Graphics[{Black, Line[{{0, 0}, {a, 0}}]}],(*the vertical line*)
  Graphics[{Green,
    Line[{{a, 0}, {a, Sum[a r^i, {i, 0, 10}]}}]}],(*The diagonal line*)
  Graphics[{Blue,
    Line[{{0, 0}, {a,
       Sum[a r^i, {i, 0, 10}]}}]}],(*The horizontal lines*)
  Table[Graphics[{Black,
     Line[{{(Sum[a r^b, {b, 0, i}] - a r^i)/(Sum[a r^i, {i, 0, 10}]/
         a), (Sum[a r^b, {b, 0, i}] -
          a r^i)}, {a, (Sum[a r^b, {b, 0, i}] - a r^i)}}]}], {i, 0,
    10}], AxesLabel -> {"x", "y"}, PlotRange -> {-1, 8}], {a, 1,
  4}, {r, 0.1, 0.9, 0.1}]
might help the black lines from crossing the blue line as r increases?
To elaborate a little the division is just based on the fact that we have a blue line from 0,0 to wherever. I just use the old line equation y=mx+c (we can drop the +c part) rearranged to y/m=x to give us the x coordinate of where a black line xcoord sits in relation to our blue line. It isn't brilliant (I'm sure there are better ways, plus there is probably a way more efficient way of writing what you are doing in Mathematica) but that is just quickly how I saw it :)

