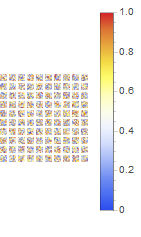
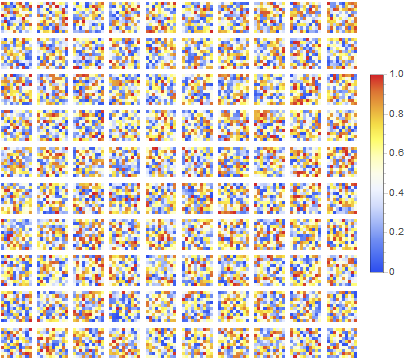
I have a GraphicsGrid of MatrixPlots in the range between 0 and 1 and I want to show a single legend for all of the grid with the appropriate color range.
I tried:
Row[{GraphicsGrid[
   Table[Graphics[
     MatrixPlot[RandomReal[1, {10, 10}], Frame -> False,
      FrameTicks -> False, ColorFunction -> "TemperatureMap"]], {x, 1,
      10}, {y, 1, 10}]], BarLegend[{"TemperatureMap", {0, 1}}]}]
But the legend's color range does not match those of the graphics. Is there an alternative way to generate a legend?
I found two posts with a similar topic, but I'm not sure how to apply this to my data


