6
$\begingroup$

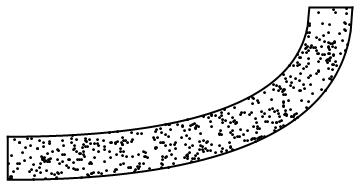
I asked a question about filling the space between two curves (Sin and Cos) with random points and the answer I received does not work for InterpolatingFunctions. How can I fill the space between two BezierCurves or InterpolatingFunctions?

For example, I have the BezierCurves c1 and c2:

c1 = {{0, 0}, {2, 0}, {2, 1}};
c2 = {{0, 0.25}, {1.75, 0.25}, {1.75, 1}};

Graphics[{BezierCurve@c1,BezierCurve@c2}]

I can use RandomPoint by turning these curves into a Polygon:

f[c_] := Quiet@
   Interpolation[BezierFunction[c][#] & /@ Range[0, 1, 0.01]];
g[c_] := {#, f[c][#]} & /@ Range[0, c[[-1, 1]], 0.01];

h1 = Join[{c2[[1]]}, g@c1]; h2 = Join[g@c2, {c1[[-1]]}];

Graphics[{
  Point@RandomPoint[Polygon@Join[h1, h2], 500],
  Thick, Line@h1, Line@h2
  }]

enter image description here

My question is, is there a better/more efficient way of doing this?

$\endgroup$
1
  • 1
    $\begingroup$ To people trying to solve this: here is a possible pitfall to be aware of. $\endgroup$ Commented Apr 21, 2017 at 16:03

3 Answers 3

3
$\begingroup$
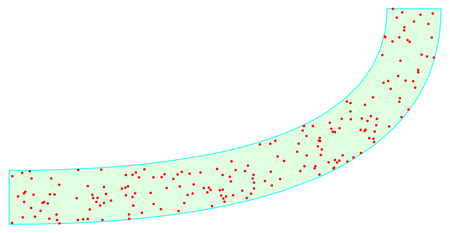
  • Only add a Line and set CurveClosed -> True to draw a closed contour.
c1 = {{0, 0}, {2, 0}, {2, 1}};
c2 = {{0, 0.25}, {1.75, 0.25}, {1.75, 1}};

reg = JoinedCurve[{BezierCurve@c1, Line[{Last@c1, Last@c2}], 
     BezierCurve@Reverse@c2}, CurveClosed -> True] // 
   BoundaryDiscretizeGraphics;
Graphics[{{EdgeForm[Cyan], FaceForm[LightGreen], reg}, Red, 
  Point@RandomPoint[reg, 200]}]

enter image description here

$\endgroup$
1
$\begingroup$

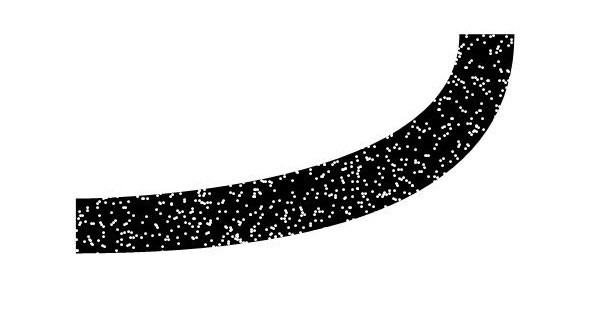
you can do it with sorcery...

c1 = {{2, 1}, {2, 0}, {0, 0}};
c2 = {{0, 0.25}, {1.75, 0.25}, {1.75, 1}};
gk = JoinedCurve[{Line[{{0, 0}, {0, 0.25}}], BezierCurve@c2, 
Line[{{1.75, 1}, {2, 1}}], BezierCurve@c1}];
Graphics[{Black, 
FilledCurve[{BezierCurve@c1, Line[{{0, 0}, {0, 0.25}}], 
BezierCurve@c2, Line[{{1.75, 1}, {2, 1}}]}], White, 
Point[RandomPoint[Disk[{1, 0.45}, {1.3, 0.9}], 5000]]}]

:)

$\endgroup$
1
$\begingroup$

(Not an answer -- a comment/follow-up of the answer by @cvgmt.)

I expected NIntegerate to work also for this.

c1 = {{0, 0}, {2, 0}, {2, 1}};
c2 = {{0, 0.25}, {1.75, 0.25}, {1.75, 1}};

reg = JoinedCurve[{BezierCurve@c1, Line[{Last@c1, Last@c2}], 
     BezierCurve@Reverse@c2}, CurveClosed -> True] // 
   BoundaryDiscretizeGraphics;

res = Reap@
  NIntegrate[x, x \[Element] reg, Method -> "MonteCarlo", 
   PrecisionGoal -> 1.2, EvaluationMonitor :> Sow[{x}]]

But it gives the monitored point unevaluated:

{{0.596312, 0.204349}, {{{x}, {x}, {x}, {x},...

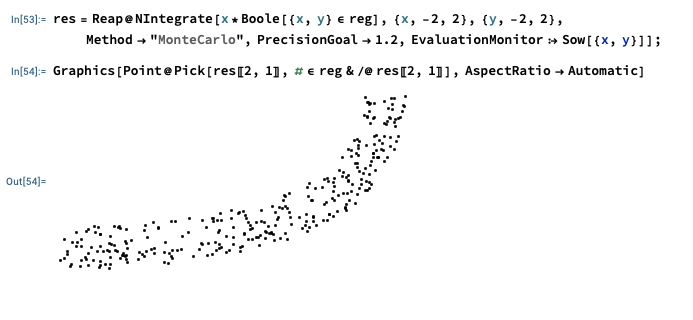
This work around can be used, but that is suboptimal:

res = Reap@
   NIntegrate[x*Boole[{x, y} \[Element] reg], {x, -2, 2}, {y, -2, 2}, 
    Method -> "MonteCarlo", PrecisionGoal -> 1.2, 
    EvaluationMonitor :> Sow[{x, y}]];

Graphics[Point@Pick[res[[2, 1]], # \[Element] reg & /@ res[[2, 1]]], 
 AspectRatio -> Automatic]

enter image description here

$\endgroup$
2
  • 1
    $\begingroup$ This works for me: res = Reap@NIntegrate[1, {x, y} \[Element] reg, Method -> "MonteCarlo", PrecisionGoal -> 1.2, EvaluationMonitor :> Sow@{x, y}]; $\endgroup$
    – Goofy
    Commented Feb 25 at 18:03
  • $\begingroup$ @Goofy Thank you! Good to know! $\endgroup$ Commented Feb 25 at 18:18

Your Answer

By clicking “Post Your Answer”, you agree to our terms of service and acknowledge you have read our privacy policy.

Not the answer you're looking for? Browse other questions tagged or ask your own question.