4
$\begingroup$

I am trying to use the solution to $R^2 \left(1-\frac{1}{r}\text{Erf}[r/4]\right)=r^2$ for $r$ in the function

Potential$(R)=\frac{1}{R^2}\left(1-\frac{1}{r}\text{Erf}\left(r/4\right)\right)$

and plot this between $R=0$ and $R=5$. Essentially for each value of $R$, I want to solve the first equation for $r$ and then insert that $r$ into the second equation and plot. I use the code

T[R_] = First[r /. Solve[R^2 (1 - 1/r Erf[r/4]) == r^2, r, Reals]]
Potential[R_] = 1/R^2 (1 - 1/T[R] Erf[T[R]/4])
Plot[Potential[R], {R, 0, 5}]

However, T[R_] outputs $r$, which is not what I want, and then Potential[R_] outputs $(1 - (2 Erf[r/4])/r)/R^2$. Any ideas? I have tried using NSolve instead of Solve but this does not help.

$\endgroup$
3
  • $\begingroup$ it returns r simply because Solve cant solve that. Do you imagine that equation should have an analytic solution? $\endgroup$
    – george2079
    Commented Apr 15, 2017 at 13:14
  • $\begingroup$ I think it should, using NSolve then for example First[r /. NSolve[5^2 (1 - 1/r Erf[r/4]) == r^2, r, Reals]] gives -4.47771 $\endgroup$ Commented Apr 15, 2017 at 13:51
  • $\begingroup$ of course, NSolve can numerically handle many things, where Solve can not obtain an analytic soluton. $\endgroup$
    – george2079
    Commented Apr 15, 2017 at 16:40

3 Answers 3

4
$\begingroup$

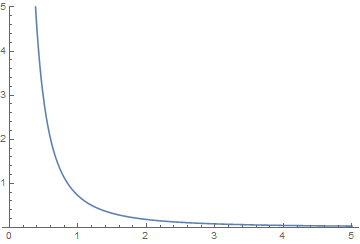
Indeed, the plot can be obtained numerically.

T[R_?NumericQ] := First[r /. NSolve[R^2 (1 - 1/r Erf[r/4]) == r^2, r, Reals]] 
Potential[R_?NumericQ] := 1/R^2 (1 - 1/T[R] Erf[T[R]/4]) 
Plot[Potential[R], {R, 0, 5}, PlotRange -> {0, 5}]

enter image description here

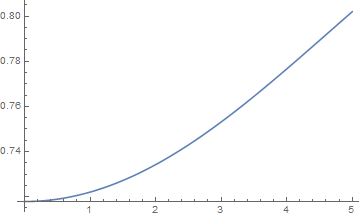
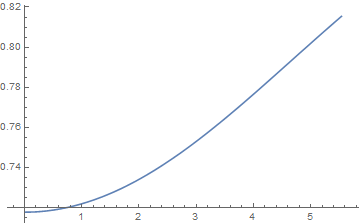
Note that Potential is singular at R == 0, so it might be more informative to plot.

Plot[R^2 Potential[R], {R, 0, 5}]

enter image description here

$\endgroup$
4
$\begingroup$

FYI you can do that plot parametrcially and avoid numerically solving for r :

RR[r_] = R /. Solve[R^2 (1 - 1/r Erf[r/4]) == r^2, R] // First
pot[r_] = 1/RR[r]^2 (1 - 1/r Erf[r/4])
ParametricPlot[{RR[r], RR[r]^2 pot[r]}, {r, -5, 0}, 
 AspectRatio -> 1/GoldenRatio]

enter image description here

$\endgroup$
1
$\begingroup$

Or, another way could be find the solution for several numbers (x,y) and then interpolate as Interpolate will create a function for you.

interpF = Interpolation[datalist_as_x_y_pairs];

then

interpF[any_x] will get you the y value you are looking for
$\endgroup$

Your Answer

By clicking “Post Your Answer”, you agree to our terms of service and acknowledge you have read our privacy policy.

Not the answer you're looking for? Browse other questions tagged or ask your own question.