5
$\begingroup$

In my code I have a ColorFunction that is meant to highlight all values of $f(x)$ that are greater than $x$

ColorFunction -> (If[#1 >= #2, Red, Black] &)

so that, for example, the parts of the plot of $3\sin^3(x)$ in the figure below that lie above the line $y=x$ should be red, and the parts below, black, but that's not what I get:
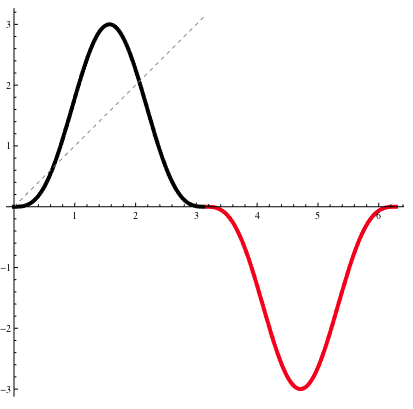
enter image description here

What am I missing? I expect I've make some simple (and embarrassing) mistake here, but I'm not seeing it.


Show[
 ParametricPlot[{u, 3 Sin[u]^3}, {u, 0, 2 Pi}, ColorFunction -> (If[#1 >= #2, Red, Black] &), 
  PlotStyle -> {Thickness[.01]}, PlotRange -> All],
 Plot[x, {x, 0, Pi}, PlotStyle -> {Gray, Dashed}]]
$\endgroup$
1
  • $\begingroup$ Related: (13046) $\endgroup$
    – Mr.Wizard
    Commented Oct 6, 2017 at 19:44

1 Answer 1

9
$\begingroup$

You are missing ColorFunctionScaling->False

 Show[
   ParametricPlot[{u, 3 Sin[u]^3}, {u, 0, 2 Pi}, 
        ColorFunction -> (If[#1 >= #2, Red, Black] &), 
        PlotStyle -> {Thickness[.01]}, PlotRange -> All, 
        ColorFunctionScaling -> False
   ], 
   Plot[x, {x, 0, Pi}, PlotStyle -> {Gray, Dashed}]
 ]

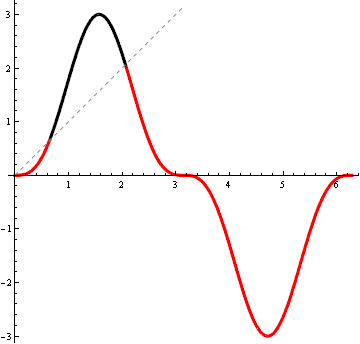
Mathematica graphics

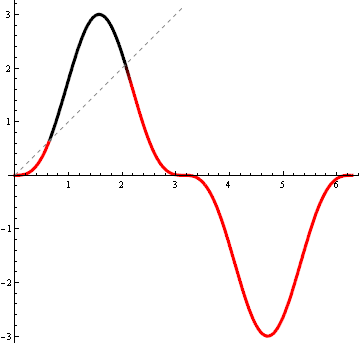
Note that the black/red boundary isn't very precise. Increasing the number of PlotPoints to, say, 200 helps:

Mathematica graphics

$\endgroup$
2
  • $\begingroup$ Well, at least I was right about "dumb and embarrassing". $\endgroup$
    – orome
    Commented Nov 4, 2012 at 21:52
  • $\begingroup$ @raxacoricofallapatorius It's just one of those days... $\endgroup$ Commented Nov 4, 2012 at 21:56

Your Answer

By clicking “Post Your Answer”, you agree to our terms of service and acknowledge you have read our privacy policy.

Not the answer you're looking for? Browse other questions tagged or ask your own question.