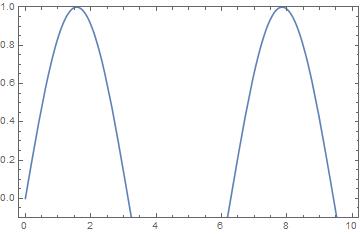
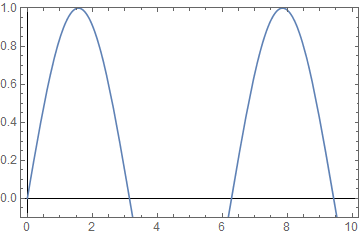
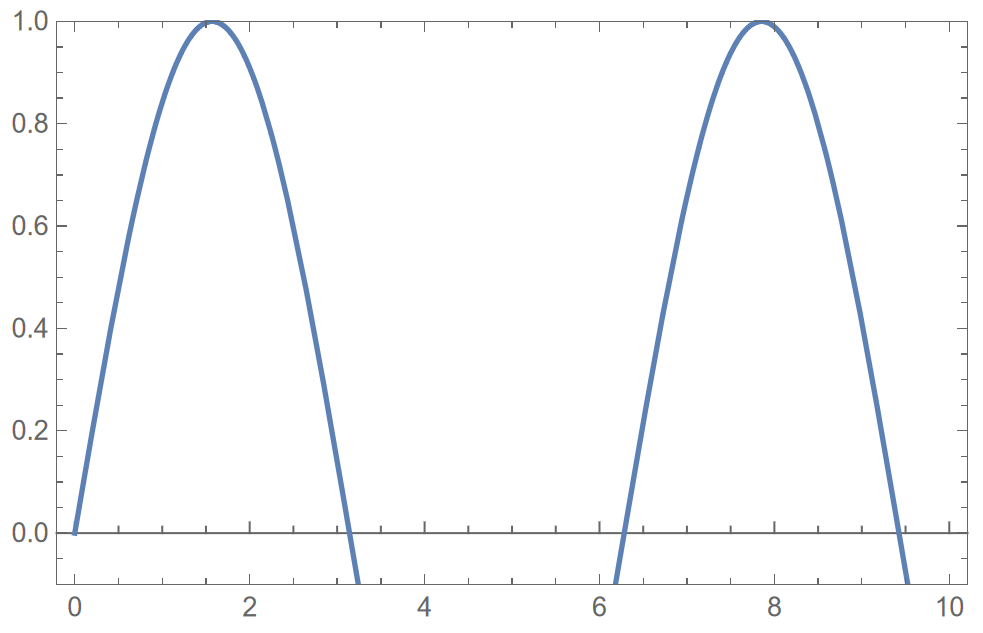
When plotting with Frame->True option, the axis is hidden when it is too close to the boundary of the plot. For example:
Plot[Sin[x], {x, 0, 10}, PlotRange -> {-0.1, 1}, Frame -> True]
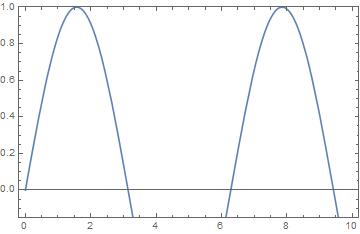
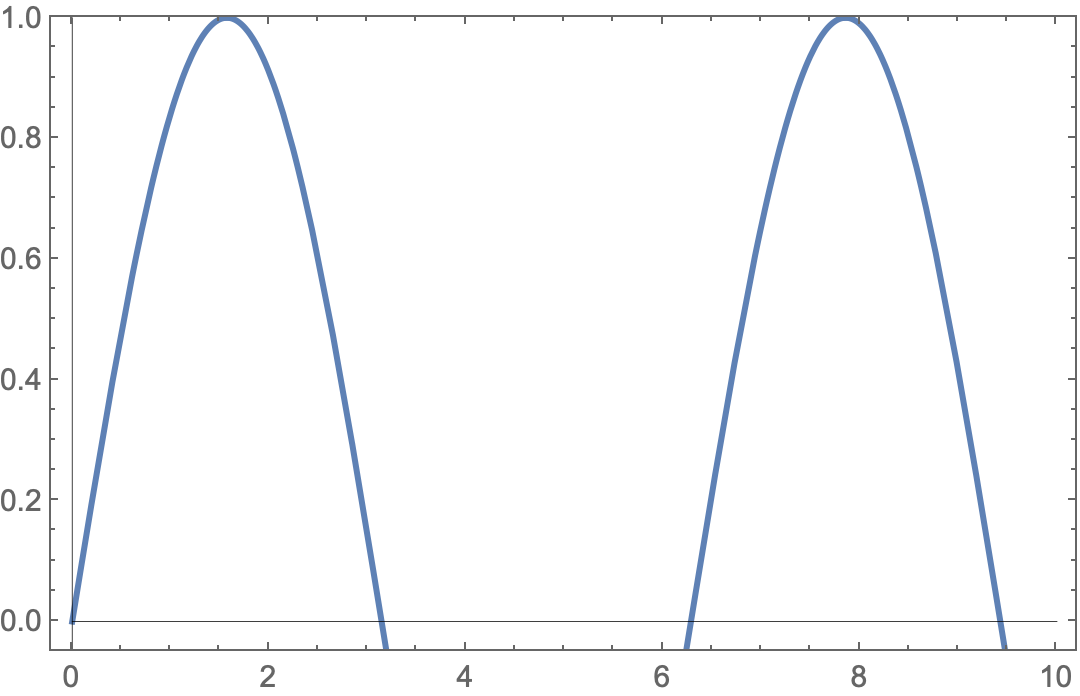
But if I increase the range, the x-axis can appear.
Plot[Sin[x], {x, 0, 10}, PlotRange -> {-0.2, 1}, Frame -> True]
How to force Mathematica to show the X-axis in the first case without changing the plotting range?

