1
$\begingroup$

I am working with BoxWhiskerChart to plot my data, but I can't figure out how to add the data points to the plot. I have read the help function many times and looked around this site, but I haven't found a solution yet.

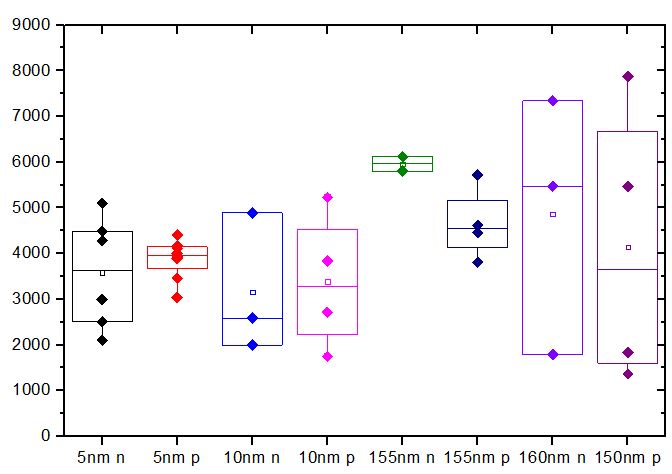
Basically what I want to do is to have a graph like I obtained with Origin (see pic).

Box and Whisker plot obtained with Origin

Can anybody help?

$\endgroup$
2
  • $\begingroup$ Please edit this question to show your data and the code you used to make your plot. People will need that to work on your problem. The answer probably will involve the plot option Epilog. $\endgroup$
    – m_goldberg
    Commented Feb 22, 2017 at 15:32
  • $\begingroup$ You can add a point or any other graphics to a BoxWhiskerChart using Epilog: SeedRandom[42]; data = Table[ RandomVariate[NormalDistribution[\[Mu], 1], 100], {\[Mu], {0, 3, 2, 5}}]; BoxWhiskerChart[data, Epilog -> {PointSize[Large], Red, Point[{3, 6}]}] $\endgroup$
    – Jason B.
    Commented Feb 22, 2017 at 15:33

2 Answers 2

1
$\begingroup$

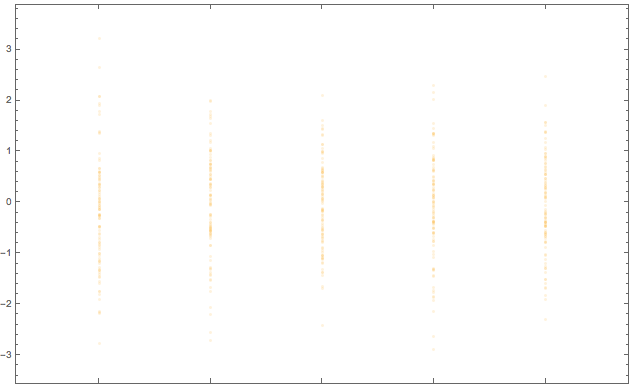
You are looking for the option ChartElementFunction. Obviously, you will need to add more to this, but here is the data portion:

Clear[dataWhisker];
dataWhisker[{{xmin_, xmax_}, _}, data_, _] := 
 With[{x = (xmax + xmin)/2}, {Opacity[0.2], Point[{x, #} & /@ data]}]

BoxWhiskerChart[RandomVariate[NormalDistribution[], {5, 100}], 
  ChartElementFunction -> dataWhisker]

enter image description here

There are a couple of additions that are possible like setting the maker, etc., and if I get the time, I will add to this. In the meantime, this should be a good start.

$\endgroup$
0
$\begingroup$
ClearAll[cF]
cF[cedf_: "BoxWhisker", o : OptionsPattern[]] := 
 Dynamic@With[{col = Darker@Darker@CurrentValue["Color"]}, {EdgeForm[{col, Thick}], 
    ChartElementDataFunction[cedf, o][##], 
    ListPlot[Thread[{Mean[#[[1]]], #2}], PlotStyle -> col, PlotMarkers -> #3[[1]]][[1]]}] &

Examples:

SeedRandom[3]
dt = RandomVariate[NormalDistribution[], {5, 10}];
markers = Graphics`PlotMarkers[][[;; 5]];

BoxWhiskerChart[Thread[dt -> markers], {{"MeanMarker", 1}, {"MedianMarker", None}}, 
 ChartStyle -> 1, ChartElementFunction -> cF[]]
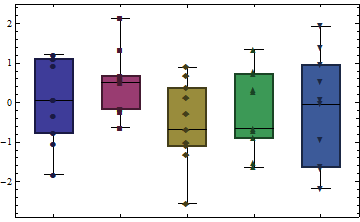
Mathematica graphics

BoxWhiskerChart[Thread[dt -> markers], {{"MeanMarker", 1}, {"MedianMarker", None}}, 
 ChartStyle -> 1, ChartBaseStyle -> FaceForm[], 
 ChartElementFunction -> cF[]]
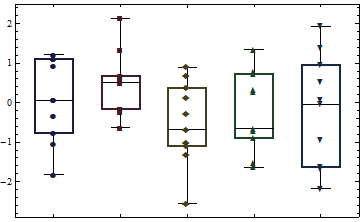
Mathematica graphics

$\endgroup$

Your Answer

By clicking “Post Your Answer”, you agree to our terms of service and acknowledge you have read our privacy policy.

Not the answer you're looking for? Browse other questions tagged or ask your own question.