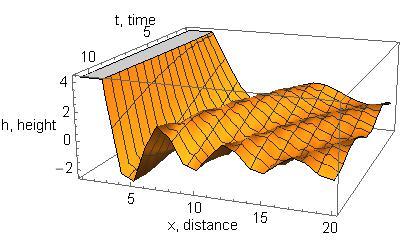
I am able to quickly create this minimal working example 3D Plot:
data = Table[Sin[2*Pi*x*(t - 4)]/x, {x, .0001, 2, .1}, {t, 5, 6, 0.1}];
ListPlot3D[data, AxesLabel -> {"t, time", "x, distance", "h, height"}]
My problem is that I can't figure out how to format the data so that the "x, distance" axis and the "t,time" axis have the correct values. In this example, x should go from 0 to 2; it instead goes from 0 to 20. t should go from 5 to 6, and it instead goes from 0 to 10.
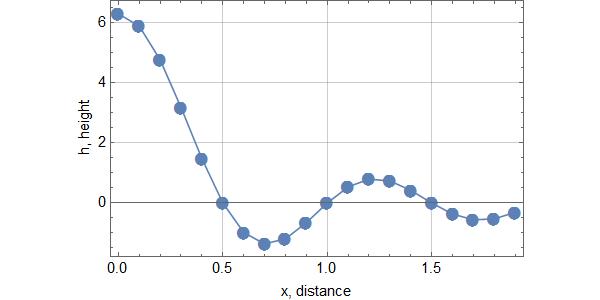
When doing it in 2D, and using ListPlot or ListLinePlot, the function Transpose can be used, or the data can be generated like this:
data2D = Table[{x, Sin[2*Pi*x*(1)]/x}, {x, .0001, 2, .1}];
ListPlot[data2D, ImageSize -> {600, 300} , GridLines -> Automatic, PlotMarkers -> {Automatic, 20}, Joined -> True, Frame -> True]
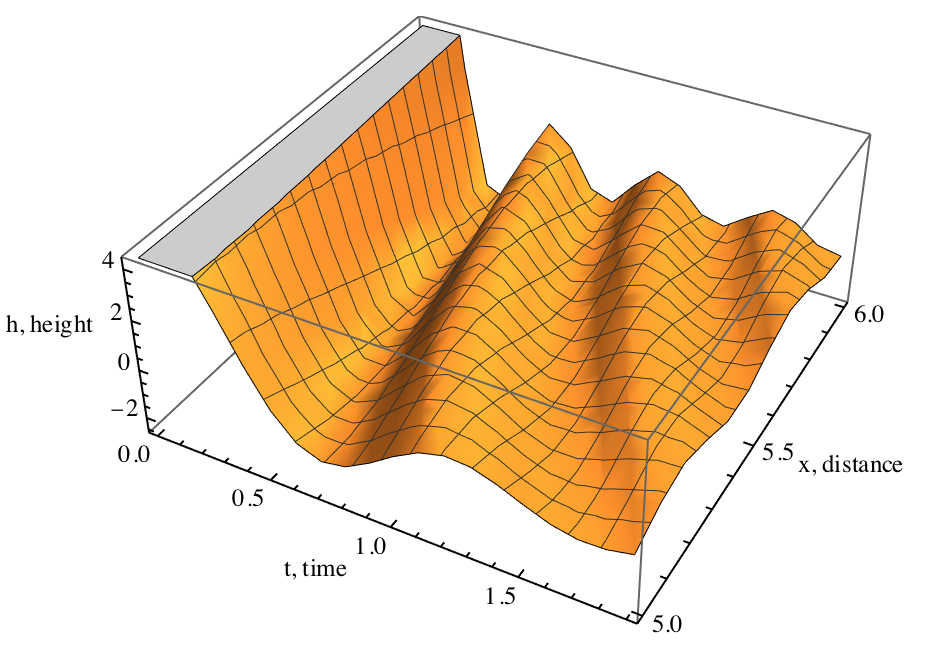
How can I do this in 3D? I have tried a bunch of stuff, including:
data = Table[{t, Table[{x, Sin[2*Pi*x*t]/x}, {x, .0001, 2, .1}]}, {t, 1, 1.5, 0.5}]
And
data = Table[Table[{t, x, Sin[2*Pi*x*t]/x}, {x, .0001, 2, .1}], {t, 1, 1.5, 0.5}]
But these, among the many other attempts, don't seem to work. There are several similar examples on SE Mathematica, but I haven't found one that specifically addresses how to organize the data for a simple plot. The wolfram documentation also doesn't elaborate very well.


DataRange? $\endgroup$