It should be a boring question to ask for someone, but this is very basic need which I haven't resolved by myself. I know I can use MapThread and pure function to make it short and beautiful, but even though I tried, I haven't been successful yet.
Here is the code. Basically, I'd like to get data and plot them. How would you write it in a efficient and elegant way? Any help will be very appreciable. So, I can keep learning.
data = {{"Anneal Temp", "L/L0", "L/L0", "L/L0", "L/L0",
    "L/L0"}, {"C\\+(o)", "%", "%", "%", "%", "%"}, {"Anneal Temp",
    "25C", "40C", "50C", "60C", "25C_HP"}, {25.`, 100.`, 100.`, 100.`,
     100.`, 100.`}, {400.`, 94.10705`, 96.7285`, 96.58404`, 96.79382`,
     97.32171`}, {600.`, 92.67395`, 95.23963`, 94.87605`, 95.48717`,
    92.52326`}, {800.`, 82.6344`, 86.78122`, 87.94923`, 89.8549`,
    85.86822`}, {1000.`, 55.62473`, 61.00761`, 61.45969`, 63.37078`,
    65.06202`}};

x = data[[4 ;;, 1]];
y1 = data[[4 ;;, 2]];
y2 = data[[4 ;;, 3]];
y3 = data[[4 ;;, 4]];
y4 = data[[4 ;;, 5]];
y5 = data[[4 ;;, 6]];

p1 = Thread[{x, y1}];
p2 = Thread[{x, y2}];
p3 = Thread[{x, y3}];
p4 = Thread[{x, y4}];
p5 = Thread[{x, y5}];

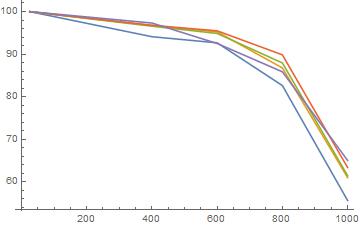
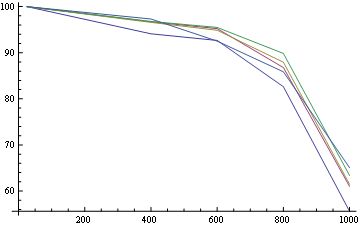
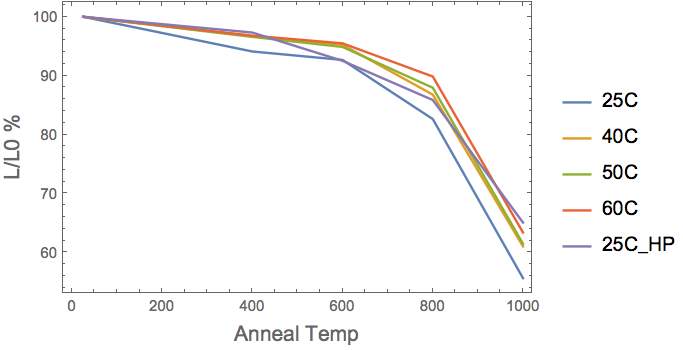
ListLinePlot[{p1, p2, p3, p4, p5}]


