4
$\begingroup$

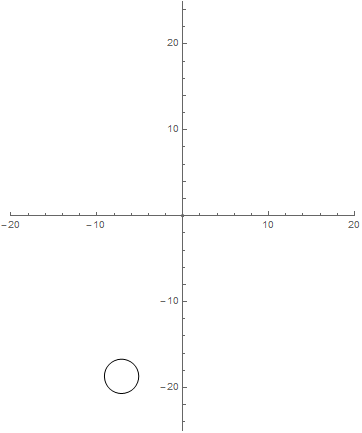
I created a small animation, very simple of course, that works very well.

Export["C:\\Users\\LMC\\Desktop\\Figure.gif",Flatten@@Table[Graphics[{Point[{0,0}],GeometricTransformation[Circle[{0,-20},2],RotationTransform[(50Sin[#-(3 π)/2]) Degree]]},PlotRange->{{20,-20},{-25,25}},Axes->True],1]&/@Range[0,10,0.05]]

enter image description here

In the future I will create animations that I intend to subdivide using $r1$, $r2$, $r3$, $r4$ and $r5$. All with different characteristics, but all varying equally with Range [0,10,0.05].

I tried to do a test with a value $r1$ based on the successful animation above, but at the beginning, two problems arose.

Surely this must be something very simple and possibly this question can be a duplicate.

The first problem was that the starting position is not the same as that of the previous animation. I tried to make $r1$ as an "argument" for substitution.

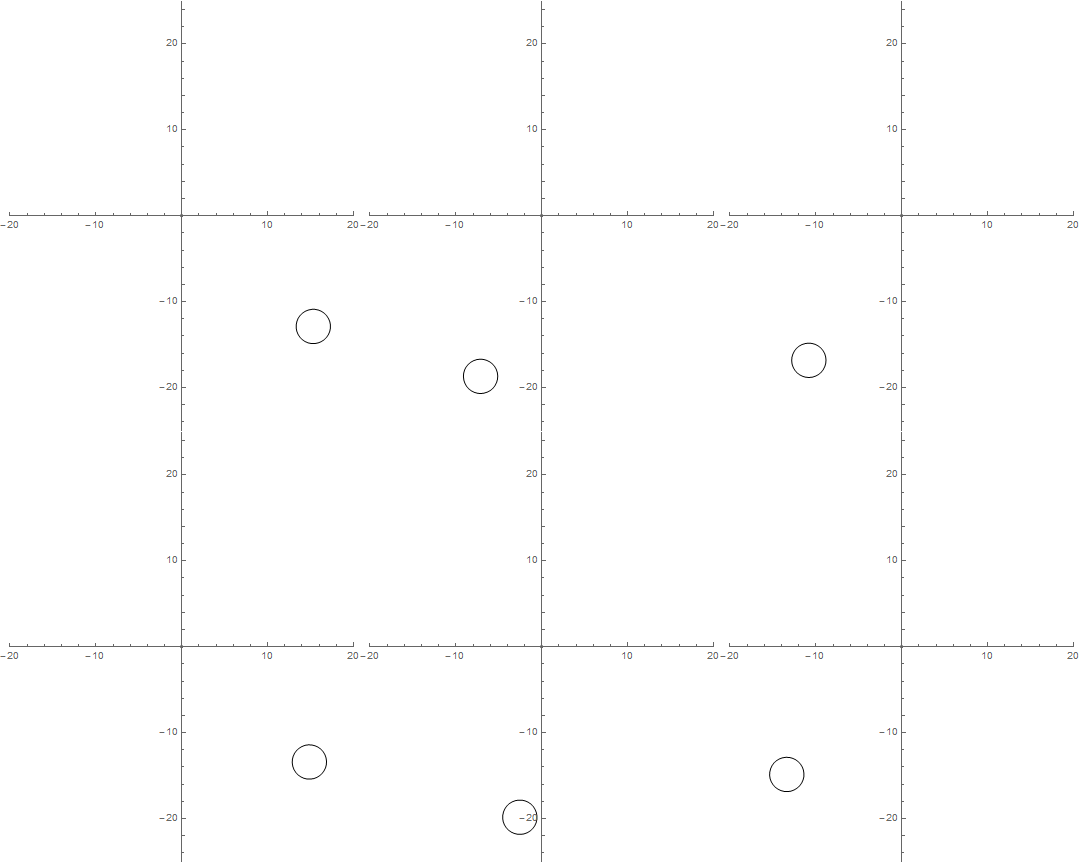
The second problem was that all frames were the same.

r1=GeometricTransformation[Circle[{0,-20},2],RotationTransform[(50Sin[#-(3 π)/2]) Degree]];
Export["C:\\Users\\Leandro\\Desktop\\Figure.gif",Flatten@@Table[Graphics[{Point[{0,0}],r1},PlotRange->{{20,-20},{-25,25}},Axes->True],1]&/@Range[0,10,0.05]]

PNG

I do not understand what might be wrong.

$\endgroup$
3
  • $\begingroup$ What do you mean by $r1$ etc? What are you trying to achieve ultimately? Perhaps there's a more direct way. $\endgroup$
    – MarcoB
    Commented Dec 5, 2016 at 17:55
  • $\begingroup$ @MarcoB I intend to insert several "pendulums" with different frequencies. But using your answer I would like to advance using my attempts. You may already have the solution, but if I succeed, I will update the issue. $\endgroup$
    – LCarvalho
    Commented Dec 5, 2016 at 18:17
  • $\begingroup$ Excellent idea. Hope it helps. $\endgroup$
    – MarcoB
    Commented Dec 5, 2016 at 20:01

1 Answer 1

4
$\begingroup$

I think this might be what you are after:

r1 = RotationTransform[(50 Sin[# - (3 Pi)/2]) Degree]&;

frames = Graphics[
     {Point[{0, 0}],
      GeometricTransformation[
        Circle[{0, -20}, 2],
        r1[#]
      ]
     },
     PlotRange -> {{20, -20}, {-25, 25}}, Axes -> True
   ]& /@ Range[0, 10, 0.05];

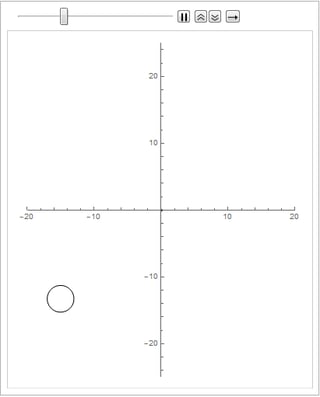
You can take a look at the result within Mathematica using ListAnimate:

ListAnimate[frames]

Mathematica graphics

$\endgroup$

Your Answer

By clicking “Post Your Answer”, you agree to our terms of service and acknowledge you have read our privacy policy.

Not the answer you're looking for? Browse other questions tagged or ask your own question.