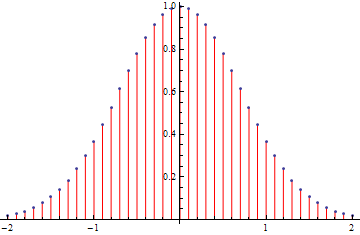
In a non-joined ListPlot one can specify that a filling line is shown for each point:
ListPlot[Table[{x, Exp[-x^2]}, {x, -2, 2, 0.1}], Filling -> Axis, FillingStyle -> Red]

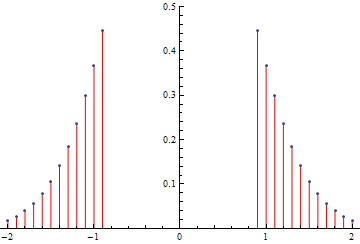
But if the points are out of the plot range, the filling line no longer appears:
ListPlot[Table[{x, Exp[-x^2]}, {x, -2, 2, 0.1}], Filling -> Axis, FillingStyle -> Red,
  PlotRange -> {0, 0.5}]

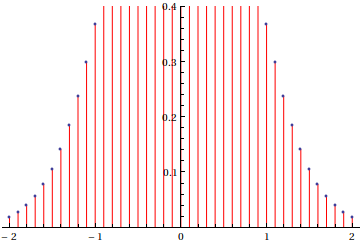
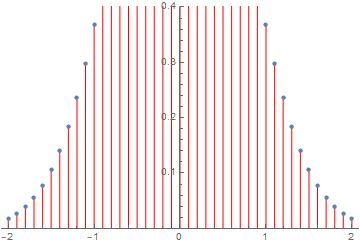
Is there any way to still show the line up the plot range, to show that there is a point there (but you just can't see it)? Or must I draw the lines myself with a Prolog?


