added 54 characters in body
Source Link
halirutan
  • 113.4k
  • 7
  • 266
  • 479

One solution is to use ListPlot with PlotRange->All (in your example you don't need it) and crop the region afterwards by calling Show:

gr = ListPlot[Table[{x, Exp[-x^2]}, {x, -2, 2, 0.1}], Filling -> Axis,
    FillingStyle -> Red, PlotRange -> All];
Show[gr, PlotRange -> {Automatic, {0, 0.4}}]
(* or shorter Show[gr, PlotRange -> {0, 0.4}] *)
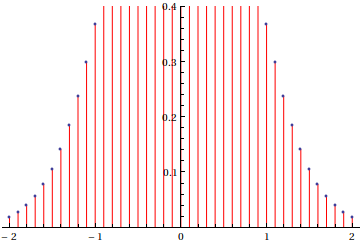
Mathematica graphics

One solution is to use ListPlot with PlotRange->All (in your example you don't need it) and crop the region afterwards by calling Show:

gr = ListPlot[Table[{x, Exp[-x^2]}, {x, -2, 2, 0.1}], Filling -> Axis,
    FillingStyle -> Red, PlotRange -> All];
Show[gr, PlotRange -> {Automatic, {0, 0.4}}]
(* or shorter Show[gr, PlotRange -> {0, 0.4}] *)

Mathematica graphics

Source Link
halirutan
  • 113.4k
  • 7
  • 266
  • 479

One solution is to use ListPlot with PlotRange->All (in your example you don't need it) and crop the region afterwards by calling Show:

gr = ListPlot[Table[{x, Exp[-x^2]}, {x, -2, 2, 0.1}], Filling -> Axis,
    FillingStyle -> Red, PlotRange -> All];
Show[gr, PlotRange -> {Automatic, {0, 0.4}}]

Mathematica graphics