10
$\begingroup$

MeshRegion has a "SmoothShading" PlotTheme which automatically computes the VertexNormals to create a nice smooth rendering. For example:

reg = BoundaryDiscretizeRegion[Ball[], PlotTheme -> "SmoothShading", 
  PrecisionGoal -> 1, MaxCellMeasure -> 0.1]

discretized ball with vertex normals

Suppose that the only data I have available is this:

gr = GraphicsComplex[MeshCoordinates[reg], MeshCells[reg, 2]];

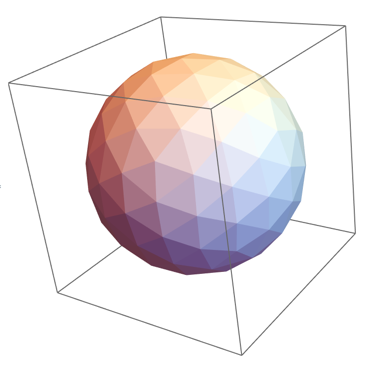
It looks like this:

Graphics3D[{EdgeForm[None], gr}]

discretized ball

Is there built-in functionality which will compute the vertex normals for a mesh like this?

I know that I can make a MeshRegion called reg, set "SmoothShading" on it, convert to Graphics3D using Show, then extract the options from the contained GraphicsComplex: Cases[Show[reg], GraphicsComplex[_, _, opt___] :> opt, Infinity]. But this is a hack and probably unreliable. What I am looking for is a built-in and easy way to return the vertex normals in a structured form. I am hoping that this functionality is exposed, I just didn't find it yet.

$\endgroup$
1
  • 2
    $\begingroup$ So VertexNormals -> Region`Mesh`MeshCellNormals[reg, 0] is not what you're looking for? Or is it? $\endgroup$
    – Michael E2
    Commented Nov 3, 2016 at 18:46

3 Answers 3

14
$\begingroup$

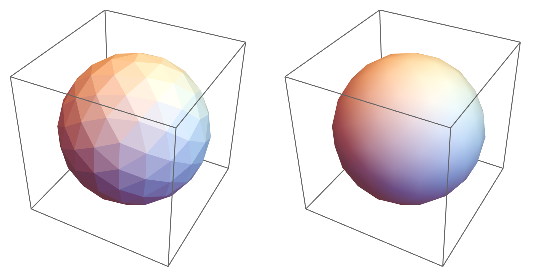
In case the undocumented internal function Region`Mesh`MeshCellNormals[meshregion, dimension] is of use to someone:

reg = BoundaryDiscretizeRegion[Ball[], PlotTheme -> "SmoothShading", 
   PrecisionGoal -> 1, MaxCellMeasure -> 0.1];
Graphics3D[
    GraphicsComplex[
     MeshCoordinates[reg],
     {EdgeForm[], Thread[MeshCells[reg, 2], Polygon]},
     VertexNormals -> #]
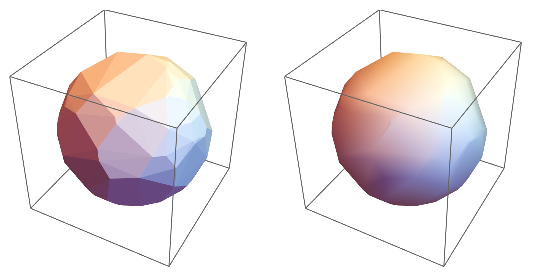
    ] & /@ {Automatic, Region`Mesh`MeshCellNormals[reg, 0]} // GraphicsRow

Mathematica graphics

Utility function for the following examples:

rplot[reg_] := Graphics3D[
   GraphicsComplex[
    MeshCoordinates[reg],
    {EdgeForm[], Thread[MeshCells[reg, 2], Polygon]},
    VertexNormals -> #]
   ] &

Examples:

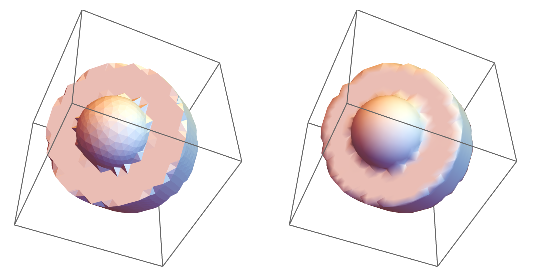
reg = BoundaryDiscretizeRegion[
   RegionUnion[Ball[], Cylinder[{{0, 0, 0}, {1, 1, 1}}, 2]]];
rplot[reg] /@ {Automatic, Region`Mesh`MeshCellNormals[reg, 0]} // GraphicsRow

Mathematica graphics

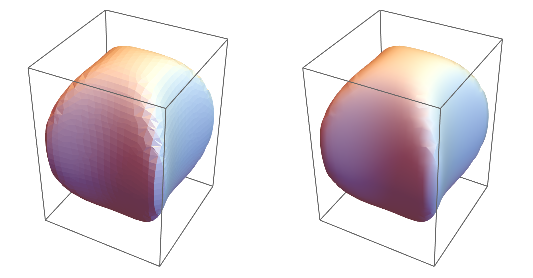
reg = BoundaryDiscretizeRegion@
   ImplicitRegion[x^2 + y^2 + z^2 + (x^2 - y^2)^2 < 4, {x, y, z}];
rplot[reg] /@ {Automatic, Region`Mesh`MeshCellNormals[reg, 0]} // GraphicsRow

Mathematica graphics

reg = ConvexHullMesh[RandomPoint[Sphere[], 100]];
rplot[reg] /@ {Automatic, Region`Mesh`MeshCellNormals[reg, 0]} // GraphicsRow

Mathematica graphics

$\endgroup$
5
  • $\begingroup$ Where could I find documentation of RegionMeshMeshCellNormals[meshregion, dimension] ? What's the meaning of dimension ? Perhaps 0: knot-normals, 1: line-normals, ...? Thanks! $\endgroup$ Commented Jan 6, 2023 at 15:49
  • $\begingroup$ @UlrichNeumann I don't believe documentation or code is available. I inferred dimension refers to the dimension of the cells for which to return normals, the same as MeshCells[]. I believe the normals correspond to, in the same order, the cells returned by MeshCells[meshregion, dimension]. $\endgroup$
    – Michael E2
    Commented Jan 7, 2023 at 19:23
  • $\begingroup$ Thank you for your plausible answer. I'm far away from understanding what a normal dimension==0 or normal dimension==3 might be. $\endgroup$ Commented Jan 7, 2023 at 20:08
  • $\begingroup$ @UlrichNeumann dimension == 0 corresponds to points (vertices). So it computes the normals at the vertices, which is what is needed for VertexNormals. I assume for dim < 2, the normals are computed as averages of the normals of the 2D facets adjoining the cell. dimension == 3 corresponds to solid cells (e.g. tetrahedra); the normals are undefined if the embedding dimension is 3 as in this Q&A. $\endgroup$
    – Michael E2
    Commented Jan 7, 2023 at 22:22
  • $\begingroup$ Thanks again. In the case dimension=0 ( surface in 3D) I suppose some kind of geometric averaging ~1/elementarea... $\endgroup$ Commented Jan 8, 2023 at 14:46
8
$\begingroup$

Its not builtin but should work for the input data type you have:

meshPoints = MeshPrimitives[reg, 0] /. Point -> Sequence;

polys = MeshPrimitives[reg, 2] /. Polygon -> Sequence;
polysRotated = RotateRight /@ polys;
polyVecs = polys - polysRotated;

surfaceNorms = 
  MapThread[Cross, {polyVecs[[All, 1]], polyVecs[[All, 2]]}]; 

polyVertexes = MeshCells[reg, 2] /. Polygon -> Sequence;

sharedVerticeAssoc = (Flatten /@ 
    Merge[{PositionIndex[polyVertexes[[All, 1]]],
      PositionIndex[polyVertexes[[All, 2]]],
      PositionIndex[polyVertexes[[All, 3]]]}, Identity]); 

SurfaceNormsAdjacentEachVertice = 
  Table[Plus[meshPoints[[i]], #] & /@ 
    surfaceNorms[[sharedVerticeAssoc[i]]], {i, 1, 
    Length[meshPoints]}];

surfaceVectorsatEachVertex = 
  Table[Riffle[
    SurfaceNormsAdjacentEachVertice[[i]], {meshPoints[[i]]}, {1, -2, 
     2}], {i, 1, Length[meshPoints]}];

Graphics3D[{Table[
   Line /@ Partition[surfaceVectorsatEachVertex[[i]], 2], {i, 
    122}], {EdgeForm[None], gr}}]

enter image description here

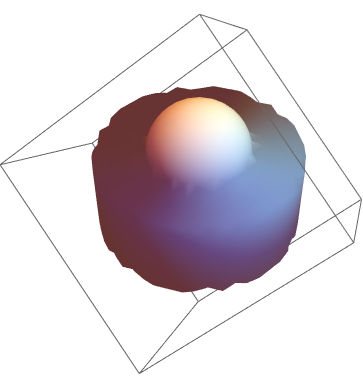
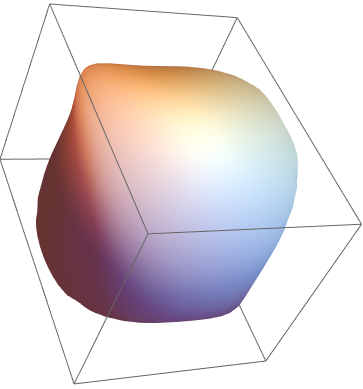
Of interest, if you compare the output with the undocumented function there is little difference until you look at more complex shapes such as Michael E2's Ball-Cylinder.

Applying my solution produces the following which while similar.... I wonder if the difference is adjustments to the normal to account for the light source or scattering. Or if the objects are being split on detected edges and the outcomes re-normalized?

Graphics3D[GraphicsComplex[MeshCoordinates[reg], {EdgeForm[],Thread[MeshCells[reg, 2], Polygon]},VertexNormals -> Total /@ SurfaceNormsAdjacentEachVertice]]

enter image description here

enter image description here

$\endgroup$
5
$\begingroup$

I gave a routine for estimating the normals of a closed mesh in this previous answer. The method is due to Nelson Max:

reg = BoundaryDiscretizeRegion[Ball[], PlotTheme -> "SmoothShading",
                               PrecisionGoal -> 1, MaxCellMeasure -> 0.1];

pts = MeshCoordinates[reg]; tri = MeshCells[reg, 2];

idx = tri[[All, 1]];

(* get neighbors for each vertex *)
nbrs = Table[DeleteDuplicates[Flatten[List @@@ First[FindCycle[
             Extract[idx, Drop[SparseArray[Unitize[idx - k],
                                           Automatic, 1]["NonzeroPositions"], None, -1],
                     # /. {k, a_, b_} | {b_, k, a_} | {a_, b_, k} :> (a -> b) &]]]]],
             {k, Length[pts]}];

(* Max's method *)
nrms = Table[Normalize[Total[With[{c = pts[[k]], vl = pts[[#]]}, 
                                  Cross[vl[[1]] - c, vl[[2]] - c]/
                                  ((#.# &[vl[[1]] - c]) (#.# &[vl[[2]] - c]))] & /@
                             Partition[nbrs[[k]], 2, 1, 1],
                             Method -> "CompensatedSummation"]], {k, Length[pts]}];

Check:

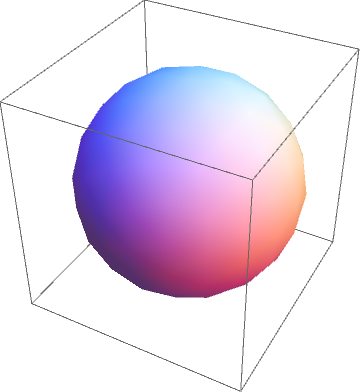
Graphics3D[{EdgeForm[], GraphicsComplex[pts, tri, VertexNormals -> nrms]}]

discretized sphere with vertex normals

Graphics3D[{EdgeForm[], GraphicsComplex[pts, Triangle[tri], VertexNormals -> nrms], 
            Arrowheads[Small], 
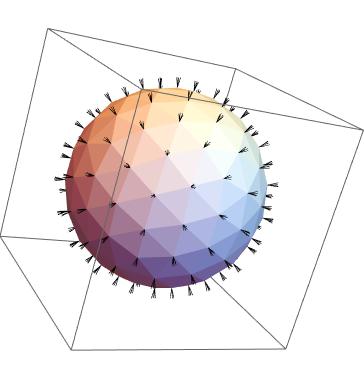
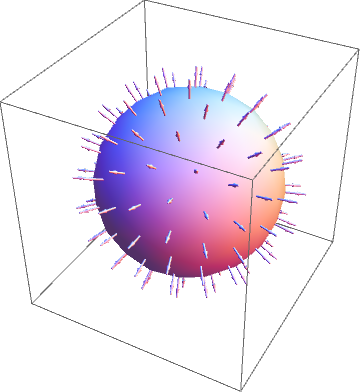
            MapThread[Arrow[Tube[{#1, #1 + #2/5}, 0.01]] &, {pts, nrms}]}]

show the normals

As noted, the implementation I gave is only intended for closed meshes; some modification is necessary if your mesh has a boundary.

$\endgroup$

Your Answer

By clicking “Post Your Answer”, you agree to our terms of service and acknowledge you have read our privacy policy.

Not the answer you're looking for? Browse other questions tagged or ask your own question.