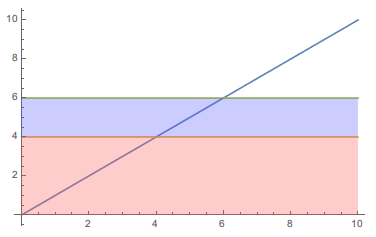
How can I add horizontal reference lines at 4 and 6 (y-axis) and shading below each reference line on the following plot?
Plot[i, {i, 1, 10}]
Thank you!
How can I add horizontal reference lines at 4 and 6 (y-axis) and shading below each reference line on the following plot?
Plot[i, {i, 1, 10}]
Thank you!
Check out Plot for reference.
Use {} to define multiple functions to be plotted and Filling for the shading.
Plot[{i, 4, 6}, {i, 0, 10}, Filling -> {3 -> {2}, 2 -> Bottom}]
Here is a solution via Epilog and graphic primitive Rectangle[]
Plot[{i, 4, 6}, {i, 0, 10},
     Epilog -> {Opacity[0.3], Lighter@Red, Rectangle[{0, 0}, {10, 4}],
                Lighter@Blue, Rectangle[{0, 4}, {10, 6}]}]
