3
$\begingroup$

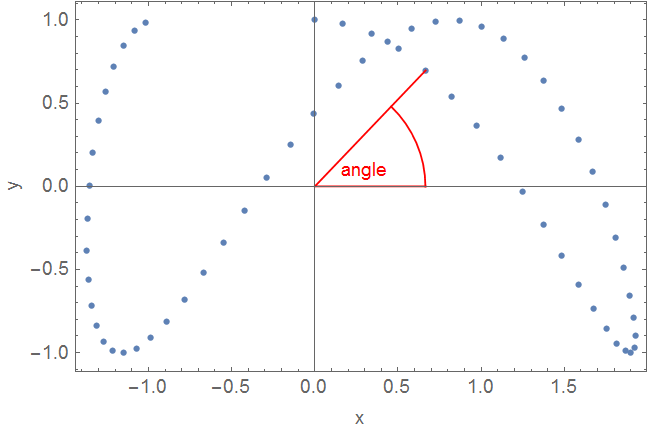
For a list of 2d coordinates I want to determine the variation of the embedded angle between the line which is connecting each coordinate and a fixed reference point and the x axis.

(* some example coordinates *)

step = 0.1;
x = Table[Sin[alpha] + Sin[0.7 alpha], {alpha, 0, 2*Pi, step}];
y = Table[Cos[2 alpha], {alpha, 0, 2*Pi, step}];

coordinates = Transpose[{x, y}];

Show[
 ListPlot[coordinates, AspectRatio -> Automatic, PlotRange -> All, 
  Frame -> True, FrameLabel -> {"x", "y"}],
 Graphics[{Red, Line[{{0, 0}, {x[[5]], y[[5]]}}]}],
 Graphics[{Red, Line[{{0, 0}, {x[[5]], 0}, {x[[5]], 0}}]}],
 Graphics[{Red, Text["angle", {0.3, 0.1}]}],
 Graphics[{Red, 
   Circle[{0, 0}, 
    x[[5]], {VectorAngle[{x[[5]], 0}, {x[[5]], y[[5]]}], 0}]}]
 ]

enter image description here

{xref, yref} = {0, 0}; (* reference point *)

x = x - xref;
y = y - yref;

angle = ArcTan[x, y ]*180/Pi;

n = Length@coordinates;
coordinateNumber = Range[n];
data = Transpose[{coordinateNumber, angle}];

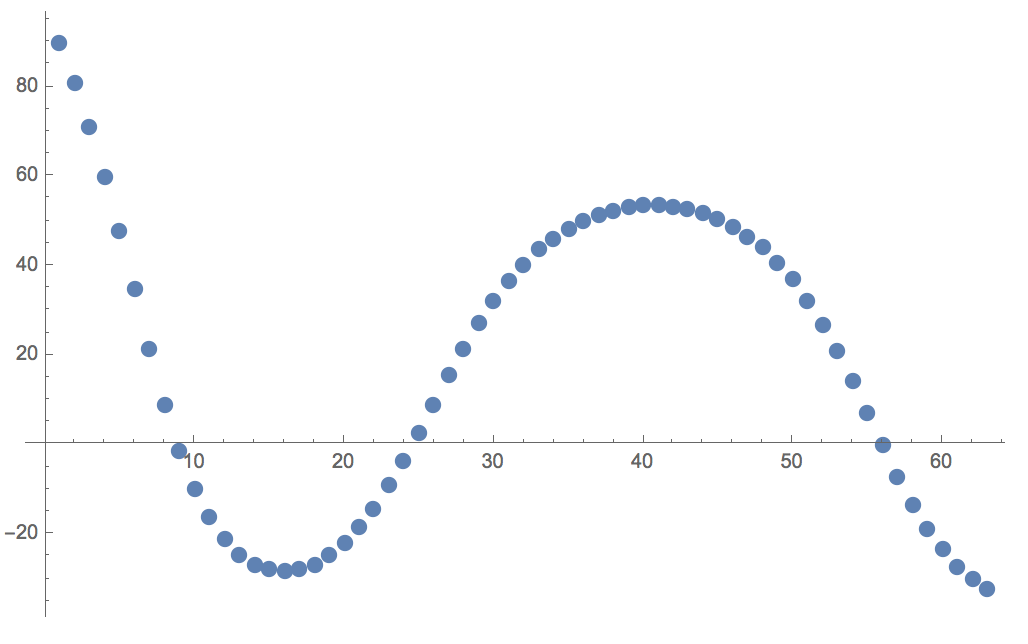
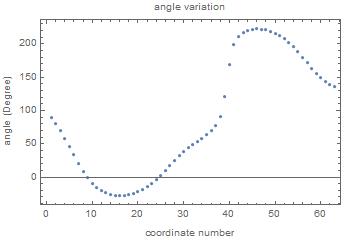
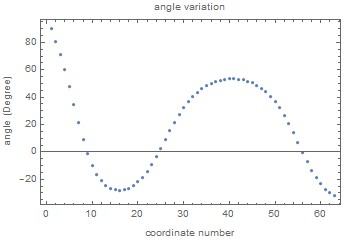
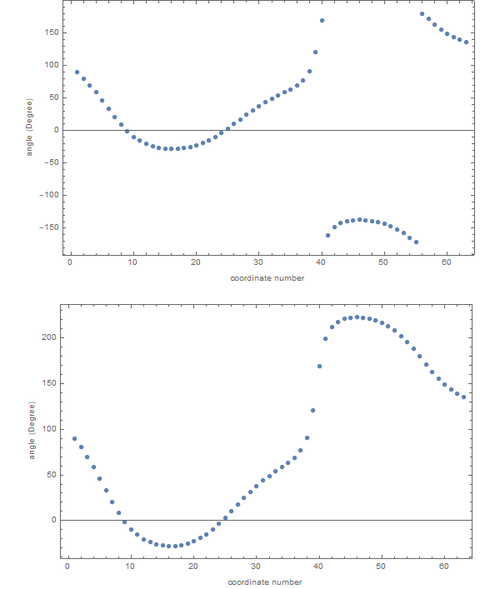
Question: How can I plot the angles where angle-"jumps" occur as a continuation of the data points seen before.


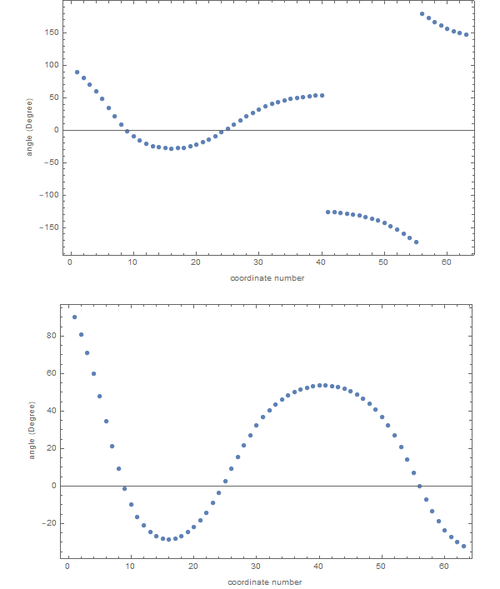
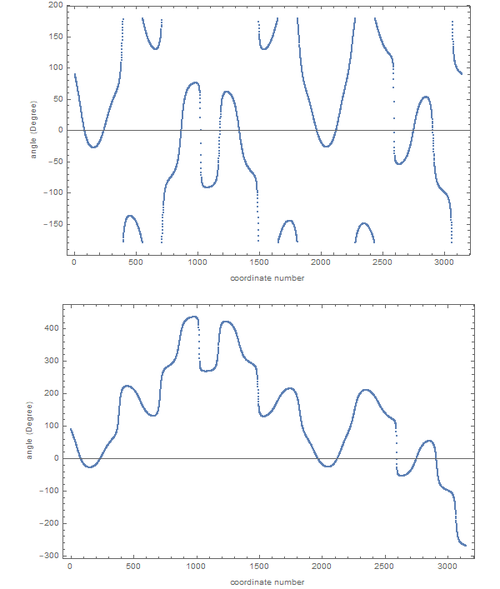
Here are three examples which are showing how the angle plot looks like (top: plot of data) and what I want to receive (below).

Case 1: x = Table[Sin[alpha] + Sin[0.7*alpha], {alpha, 0, 2*Pi, step}];

enter image description here


Case 2: x = Table[Sin[0.9*alpha] + Sin[0.7*alpha], {alpha, 0, 2*Pi, step}];

enter image description here


Case 3:

step = 0.01;
x = Table[Sin[alpha] + Sin[0.7 alpha], {alpha, 0, 10*Pi, step}];
y = Table[Cos[2 alpha], {alpha, 0, 10*Pi, step}];

enter image description here

$\endgroup$

3 Answers 3

7
+50
$\begingroup$

I assume you have no jumps larger than 180° between consecutive points (otherwise, it's not obvious which way and how many turns the angle jumps). Having said that, we transform angles in the list of increments and force all increments to be in range (−180°; 180°):

MakeContinuous[angles_, fullCircle_: 360] := Accumulate[
    {angles[[1]]} ~Join~ Mod[Differences[angles], fullCircle, -fullCircle/2]
]

That gives you the desired result with relative ease:

continuousAngle = MakeContinuous[angle];
continuousData = Transpose[{coordinateNumber, continuousAngle}];
ListPlot[continuousData]

Plot of continuous angle function

Second example

Your second example is somewhat different. If you look carefully at the equation

$$\begin{aligned}x&=\sin(0.9\alpha)+\sin(0.7\alpha)\\y&=\cos(2\alpha)\end{aligned}$$

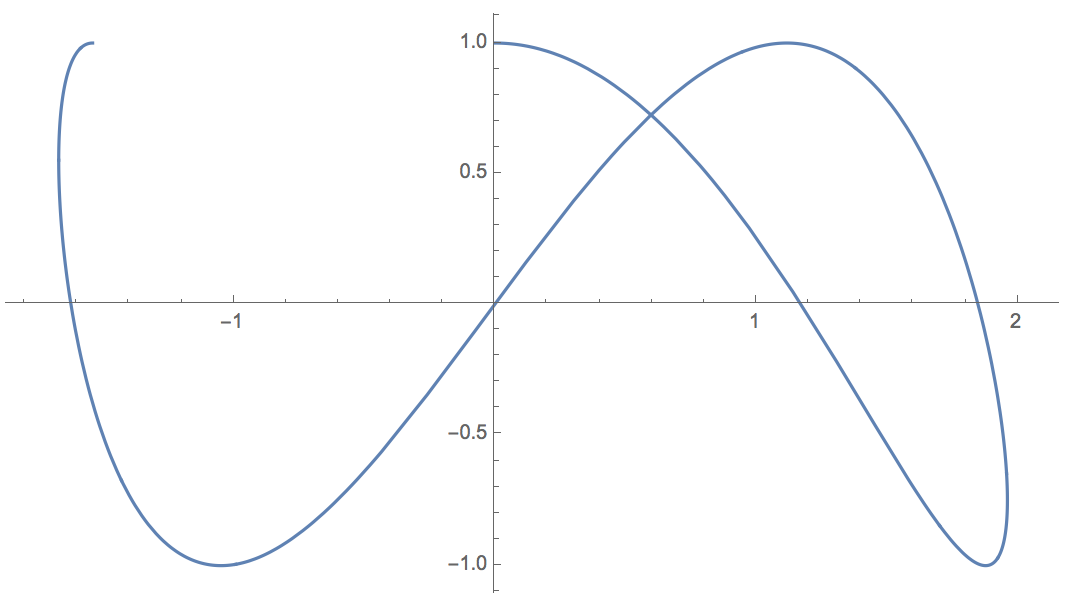
you can notice that when $\alpha=\frac{5\pi}{4}$, $y=\cos\frac{5\pi}2=0$, $x=\sin\frac{7\pi}{8} + \sin\frac{9\pi}8=0$. So your curve goes exactly through the point of reference $(0,0)$:

ParametricPlot[{Sin[0.7 t] + Sin[0.9 t], Cos[2 t]}, {t, 0, 2 Pi}]

Parametric plot of the second case

So you should expect the jump of 180°, but it's you to decide whether it should be +180° or −180° jump.

If you want a continuous function in these cases too, you may consider plotting “line angle” instead of “vector angle” (projective circle, if you want) by saying that full circle is 180°:

continuousAngle = MakeContinuous[angle, 180];
continuousData = Transpose[{coordinateNumber, continuousAngle}];
ListPlot[continuousData]

Line angle plot

$\endgroup$
2
  • $\begingroup$ This is great, but unfortunately does not solve Case 2. What could be the reason? @Carl Woll describes also a problem for the second example. $\endgroup$
    – mrz
    Commented Feb 22, 2018 at 21:41
  • $\begingroup$ I have added the explanation and suggestion about Case 2. $\endgroup$ Commented Feb 23, 2018 at 11:31
4
$\begingroup$

Just modify the definition of the angles:

first case:

    angle = 180/\[Pi] If[#[[1]] < 0 && #[[2]] < 0, 
                         ArcTan[-#[[1]], -#[[2]]] + \[Pi], 
                         ArcTan[#[[1]], #[[2]]]] & /@ coordinates;

enter image description here

second case:

angle = 180/Pi Which[#[[1]] < 0 && #[[2]] < 0, ArcTan[-#[[1]], -#[[2]]], 
                     #[[1]] < 0 && #[[2]] > 0, ArcTan[#[[1]], #[[2]]] - \[Pi],
                     True, ArcTan[#[[1]], #[[2]]]] & /@ coordinates;

enter image description here

$\endgroup$
1
  • $\begingroup$ Thank you for your help. Is it possible to obtain a single general solution for the angle modification? For example when x = Table[ Sin[1.6 alpha] + Sin[0.1 alpha] + Sin[0.9 alpha], {alpha, 0, 2*Pi, step}]; another modification would be necessary (i.imgur.com/U9RzcIV.jpg). $\endgroup$
    – mrz
    Commented Feb 20, 2018 at 16:35
4
$\begingroup$

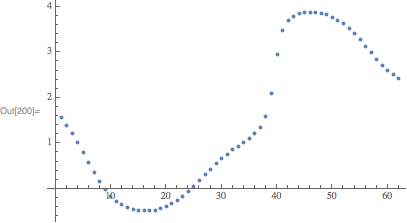
You could use an NDSolveValue based approach. First, convert your angle definition into an ODE:

eqn = angle[coord] == ArcTan[x[coord], y[coord]];
D[eqn, coord]

angle'[ coord] == -((y[coord] x'[coord])/( x[coord]^2 + y[coord]^2)) + (x[coord] y'[coord])/( x[coord]^2 + y[coord]^2)

Next, convert your $x$ and $y$ data into interpolating functions:

step = 0.1;
x = Interpolation @ Table[Sin[alpha] + Sin[0.7 alpha], {alpha, 0, 2*Pi, step}];
y = Interpolation @ Table[Cos[2 alpha], {alpha, 0, 2*Pi, step}];

Finally, use NDSolveValue:

sol = NDSolveValue[
    {D[eqn, coord], eqn /. coord -> 1},
    angle,
    {coord, 1, 2 Pi 10}
];

Visualization:

ListPlot[sol[Range[1, 2 Pi 10]]]

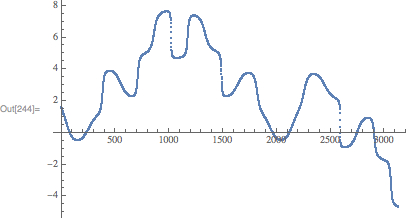
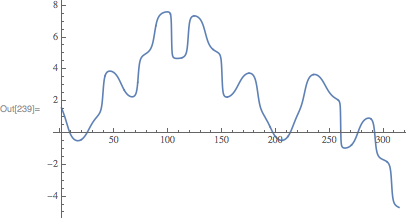
enter image description here

This approach seems to have a problem with your second example which I don't have time to investigate. For the third example we get:

step = 0.1;
x = Interpolation @ Table[Sin[alpha] + Sin[0.7 alpha], {alpha, 0, 10*Pi, step}];
y = Interpolation @ Table[Cos[2 alpha], {alpha, 0, 10*Pi, step}];
sol = NDSolveValue[
    {D[eqn, coord], eqn /. coord -> 1},
    angle,
    {coord, 1, 100 Pi}
];

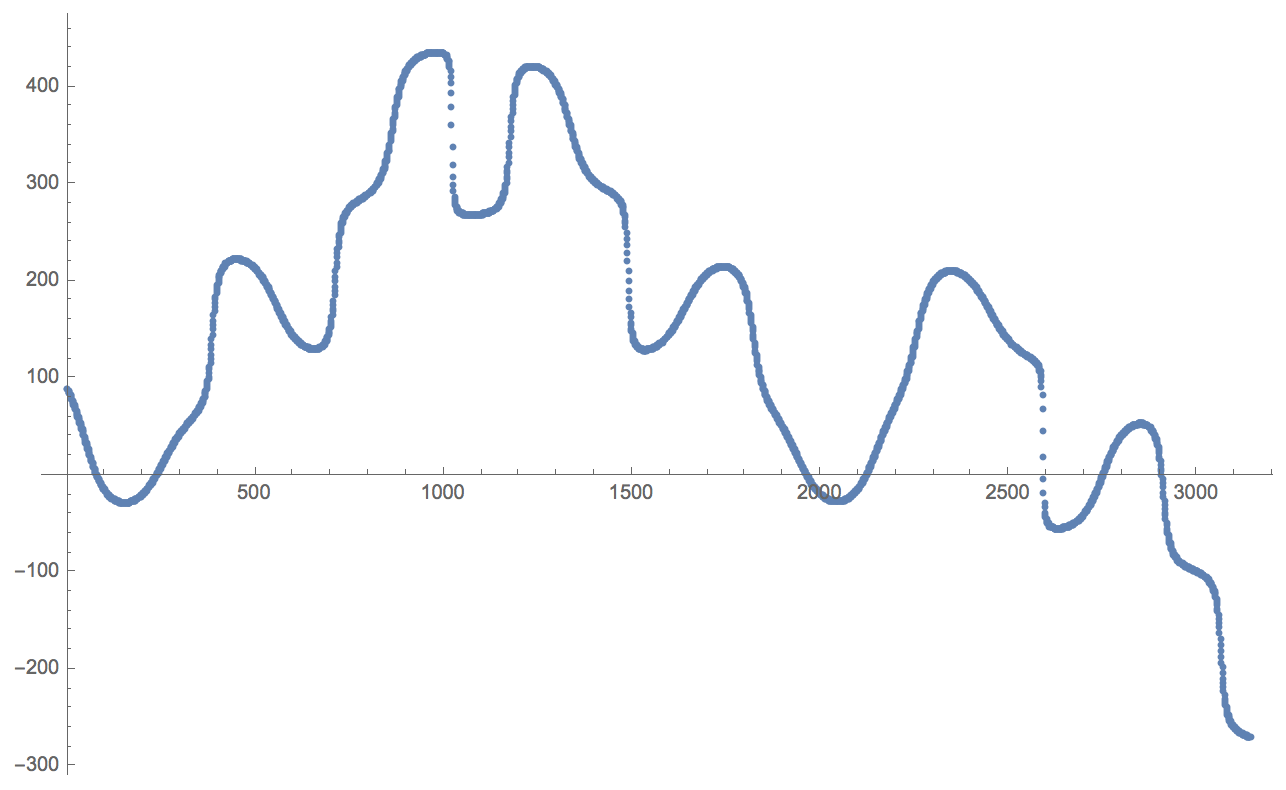
ListPlot[sol[Range[1, 100 Pi, .1]]]

enter image description here

With this approach you could also just use Plot

Plot[sol[x], {x, 1, 100 Pi}]

enter image description here

$\endgroup$
1
  • $\begingroup$ Thanks a lot for this very interesting solution. Also Vasily Mitch in his answer mentions that with his code Case 2 cannot be solved. $\endgroup$
    – mrz
    Commented Feb 23, 2018 at 11:00

Your Answer

By clicking “Post Your Answer”, you agree to our terms of service and acknowledge you have read our privacy policy.

Not the answer you're looking for? Browse other questions tagged or ask your own question.