2
$\begingroup$

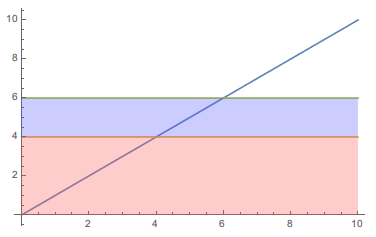
How can I add horizontal reference lines at 4 and 6 (y-axis) and shading below each reference line on the following plot?

Plot[i, {i, 1, 10}] 

Thank you!

$\endgroup$
1
  • $\begingroup$ Welcome to Mathematica.SE! I suggest the following: 1) As you receive help, try to give it too, by answering questions in your area of expertise. 2) Take the tour! 3) When you see good questions and answers, vote them up by clicking the gray triangles, because the credibility of the system is based on the reputation gained by users sharing their knowledge. Also, please remember to accept the answer, if any, that solves your problem, by clicking the checkmark sign! $\endgroup$
    – Michael E2
    Commented Jul 16, 2016 at 2:08

2 Answers 2

4
$\begingroup$

Check out Plot for reference.

Use {} to define multiple functions to be plotted and Filling for the shading.

Plot[{i, 4, 6}, {i, 0, 10}, Filling -> {3 -> {2}, 2 -> Bottom}]

enter image description here

$\endgroup$
2
$\begingroup$

Here is a solution via Epilog and graphic primitive Rectangle[]

Plot[{i, 4, 6}, {i, 0, 10}, 
     Epilog -> {Opacity[0.3], Lighter@Red, Rectangle[{0, 0}, {10, 4}], 
                Lighter@Blue, Rectangle[{0, 4}, {10, 6}]}]
enter image description here

$\endgroup$

Your Answer

By clicking “Post Your Answer”, you agree to our terms of service and acknowledge you have read our privacy policy.

Not the answer you're looking for? Browse other questions tagged or ask your own question.