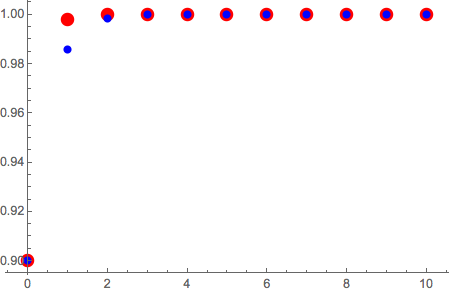
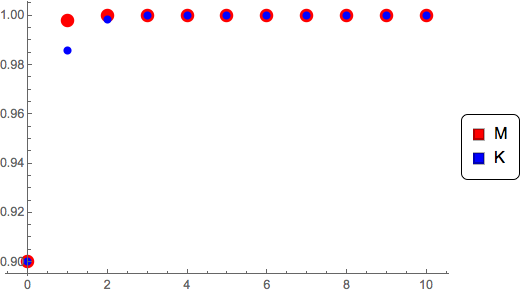
I have two data sets.
I produce the first one from the following code:
Clear[x, T, a, b]
T[x_] := T[x] =
   Piecewise[{{1 - x, 0 <= x < 1/7}, {(x + 6)/7, 1/7 <= x <= 1}}]
a[n_] := a[n] = n/(n + 1)
b[n_] := b[n] = n/(n + 5)
x[0] = 0.9;
x[n_] := x[n] =
   T[(1 - a[n - 1])* T[x[n - 1]] +
     a[n - 1]*T[(1 - b[n - 1]) x[n - 1] + b[n - 1] T[x[n - 1]]]]
Table[x[i], {i, 0, 10}]
The second one is produce this code:
Clear[x, T, a, b]
T[x_] := T[x] =
   Piecewise[{{1 - x, 0 <= x < 1/7}, {(x + 6)/7, 1/7 <= x <= 1}}]
a[n_] := a[n] = n/(n + 1)
b[n_] := b[n] = n/(n + 5)
x[0] = 0.9;
x[n_] := x[n] =
   (1 - a[n - 1])* T[x[n - 1]] +
     a[n - 1]*T[(1 - b[n - 1]) *x[n - 1] + b[n - 1] T[x[n - 1]]]
Table[x[i], {i, 0, 10}]
I want to draw a beautiful comparative graph. Let the first sequence generated by first code be sequence M and the sequence generated by second code be K.
Any help?


kandm) and doListPlot[{k, m}, Joined -> True, PlotRange -> All]$\endgroup$