0
$\begingroup$

I have two data sets.

I produce the first one from the following code:

Clear[x, T, a, b]
T[x_] := T[x] = 
   Piecewise[{{1 - x, 0 <= x < 1/7}, {(x + 6)/7, 1/7 <= x <= 1}}]
a[n_] := a[n] = n/(n + 1)
b[n_] := b[n] = n/(n + 5)
x[0] = 0.9;
x[n_] := x[n] = 
   T[(1 - a[n - 1])* T[x[n - 1]] + 
     a[n - 1]*T[(1 - b[n - 1]) x[n - 1] + b[n - 1] T[x[n - 1]]]]
Table[x[i], {i, 0, 10}]

The second one is produce this code:

Clear[x, T, a, b]
T[x_] := T[x] = 
   Piecewise[{{1 - x, 0 <= x < 1/7}, {(x + 6)/7, 1/7 <= x <= 1}}]
a[n_] := a[n] = n/(n + 1)
b[n_] := b[n] = n/(n + 5)
x[0] = 0.9;
x[n_] := x[n] = 
   (1 - a[n - 1])* T[x[n - 1]] + 
     a[n - 1]*T[(1 - b[n - 1]) *x[n - 1] + b[n - 1] T[x[n - 1]]]
Table[x[i], {i, 0, 10}]

I want to draw a beautiful comparative graph. Let the first sequence generated by first code be sequence M and the sequence generated by second code be K.

Any help?

$\endgroup$
5
  • $\begingroup$ You should put your code in code blocks. The functions that you posted are identical. Either explain what you mean by comparative graph and M and K functions or link to a description. $\endgroup$
    – Bob Hanlon
    Commented Jun 17, 2016 at 19:37
  • $\begingroup$ can I suggest if you actually have two different functions you get creative and give them different names? You should never use capital letters to start your own function names by the way. $\endgroup$
    – george2079
    Commented Jun 17, 2016 at 20:03
  • $\begingroup$ @Bob Hanlon The function are identical but original sequence will b generated due the function x[n], which are different. two sequences will be generated. for each iteration the previous value is the domain value. $\endgroup$
    – Marwat
    Commented Jun 17, 2016 at 20:11
  • $\begingroup$ @george2079 Thanks for suggestions $\endgroup$
    – Marwat
    Commented Jun 17, 2016 at 20:14
  • $\begingroup$ simply assign each of your tables to a variable (say k and m ) and do ListPlot[{k, m}, Joined -> True, PlotRange -> All] $\endgroup$
    – george2079
    Commented Jun 17, 2016 at 20:38

1 Answer 1

1
$\begingroup$

Let's first refactor your code to simplify it. Note I am removing the memoization of T, a, and b, because I don't think you gain much from memoization of these functions. You can easily restore it if you think I've misjudged the situation.

T[x_] := Piecewise[{{1 - x, 0 <= x < 1/7}, {(x + 6)/7, 1/7 <= x <= 1}}]
a[n_] := n/(n + 1)
b[n_] := n/(n + 5)

m =
  Module[{x},
    x[0] = 0.9; 
    x[n_] := x[n] = 
      T[(1 - a[n - 1])*T[x[n - 1]] + a[n - 1]*T[(1 - b[n - 1]) x[n - 1] +
        b[n - 1] T[x[n - 1]]]];
    Table[x[i], {i, 0, 10}]]

{0.9, 0.997959, 0.999961, 0.999999, 1., 1., 1., 1., 1., 1., 1.}

k =
  Module[{x},
    x[0] = 0.9; 
    x[n_] := x[n] = 
      (1 - a[n - 1])*T[x[n - 1]] + a[n - 1]*T[(1 - b[n - 1])*x[n - 1] + 
        b[n - 1] T[x[n - 1]]];
    Table[x[i], {i, 0, 10}]]

{0.9, 0.985714, 0.998105, 0.999773, 0.999975, 0.999998, 1., 1., 1., 1., 1.}

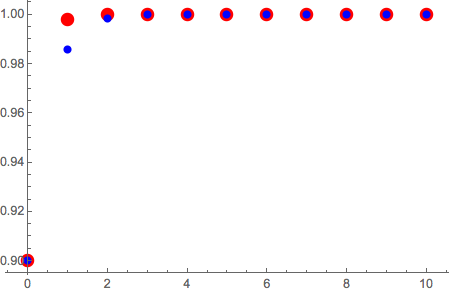
Now the plot.

ListPlot[{m, k},
  PlotMarkers -> 
    {Graphics[{Red, Disk[{0, 0}, ImageScaled[.03]]}], 
     Graphics[{Blue, Disk[{0, 0}, ImageScaled[.018]]}]},
  DataRange -> {0, 10},
  PlotRange -> All,
  PlotRangePadding -> Scaled[.05]]

plot

Update

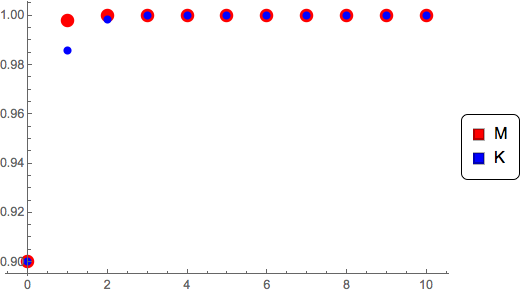
Here is a somewhat fancier version of the plot with a nice legend.

With[{
    redMkr = Graphics[{Red, Disk[{0, 0}, ImageScaled[.03]]}], 
    bluMkr = Graphics[{Blue, Disk[{0, 0}, ImageScaled[.018]]}],
    legend =
      SwatchLegend[{Red, Blue}, {"M", "K"}, 
        LegendMarkers -> Graphics[{Opacity[1], Rectangle[]}], 
        LegendFunction -> (Framed[#, RoundingRadius -> 5] &), 
        LegendMargins -> 5]},
  ListPlot[{m, k},
    DataRange -> {0, 10},
    PlotMarkers -> {redMkr, bluMkr},
    PlotRange -> All,
    PlotRangePadding -> Scaled[.05],
    PlotLegends -> legend]]

fancy

$\endgroup$
7
  • $\begingroup$ Thank you very much. If we need graphic representation instead of ploting, then what will be needed in code??? and Sir is 1. is exact value? $\endgroup$
    – Marwat
    Commented Jun 17, 2016 at 22:10
  • $\begingroup$ @Marwat. 1. is an inexact value. As to a graphic representation that is not a plot, I don't understand what distinction you are making. $\endgroup$
    – m_goldberg
    Commented Jun 17, 2016 at 22:18
  • $\begingroup$ I means from graph the attached line... $\endgroup$
    – Marwat
    Commented Jun 17, 2016 at 23:08
  • $\begingroup$ From graph I means the attached line... $\endgroup$
    – Marwat
    Commented Jun 17, 2016 at 23:14
  • $\begingroup$ @Marwat. Try adding the option Joined -> True to the plot. Does that do what you want? $\endgroup$
    – m_goldberg
    Commented Jun 18, 2016 at 0:18

Your Answer

By clicking “Post Your Answer”, you agree to our terms of service and acknowledge you have read our privacy policy.

Not the answer you're looking for? Browse other questions tagged or ask your own question.