I need some help from expert. I already read about the plot with Identity, I but I not really understand and I think my problem is different and I confuse to used what command of plot.
Here the matrix,
A = {{E^(I*β1 + I*β3)*Cos[β2*t], E^(I*β1 - I*β3)*Sin[β2*t]},
     {(-E^((-I)*β1 + I*β3))*Sin[β2*t], E^((-I)*β1 - I*β3)*Cos[β2*t]}};
β1 = 0.;
β2 = Pi;
β3 = 0.;
t = 0;

tu = Table[t++; t = t + TimeUsed[]; Print[A]; t, {i, 1, 10}]

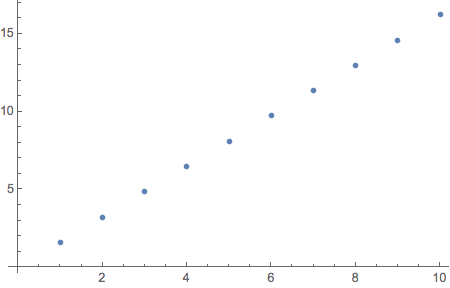
ListPlot[tu]
and the ouput;
{{0.33873792024528937 + 0.*I, -0.9408807689542262 + 0.*I},
  {0.9408807689542262 + 0.*I, 0.33873792024528937 + 0.*I}}
{{-0.7705132427757919 + 0.*I, -0.6374239897486864 + 0.*I},
  {0.6374239897486864 + 0.*I, -0.7705132427757919 + 0.*I}}
{{-0.8852313113324524 + 0.*I, 0.4651510780774637 + 0.*I},
  {-0.4651510780774637 + 0.*I, -0.8852313113324524 + 0.*I}}
{{0.0878511965507509 + 0.*I, 0.9961336091431718 + 0.*I},
  {-0.9961336091431718 + 0.*I, 0.0878511965507509 + 0.*I}}
{{0.9529793415172217 + 0.*I, 0.30303526963276495 + 0.*I},
  {-0.30303526963276495 + 0.*I, 0.9529793415172217 + 0.*I}}
{{0.6470559615694358 + 0.*I, -0.7624425110114551 + 0.*I},
  {0.7624425110114551 + 0.*I, 0.6470559615694358 + 0.*I}}
{{-0.4539904997395583 + 0.*I, -0.891006524188362 + 0.*I},
  {0.891006524188362 + 0.*I, -0.4539904997395583 + 0.*I}}
{{-0.9971589002606128 + 0.*I, 0.07532680552794735 + 0.*I},
  {-0.07532680552794735 + 0.*I, -0.9971589002606128 + 0.*I}}
{{-0.31498651965528923 + 0.*I, 0.9490961449902997 + 0.*I},
  {-0.9490961449902997 + 0.*I, -0.31498651965528923 + 0.*I}}
{{0.7542513807361156 + 0.*I, 0.6565857557529428 + 0.*I},
  {-0.6565857557529428 + 0.*I, 0.7542513807361156 + 0.*I}}
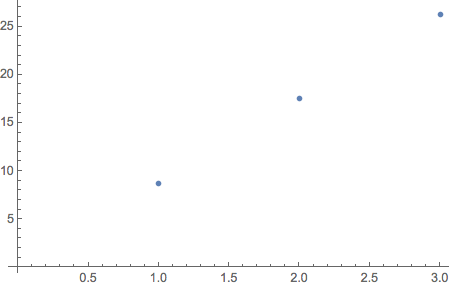
ouput of graph;
My problems;
- I want to plot the result of this matrix but i read that real part cannot be combine with imaginary part, hence How can I plot the graph that I want to consider both during plot (I mean I want to get one coordinate include real and imaginary part). It is possible?
- I used
ListPlot[tu]to represent the data. It is true?


Chop[]on the list you got. $\endgroup$