I will assume the following:
- If inflow is zero between some countries - there is no edge between them
- Inflow can be non-zero even between non-bordering countries
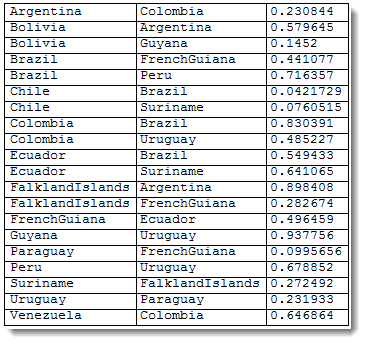
I will try to simulate your data - to get something that reminiscent of numbers after the import from Excel. Consider South America:
countries = CountryData["SouthAmerica"]; countries // Length
14
This will simulate your data
directions = Union@Table[{countries[[Mod[k, 14] + 1]],
     RandomChoice[DeleteCases[countries, countries[[Mod[k, 14] + 1]]]]}, {k, 1, 20}];

flows = DirectedEdge @@@ directions;

data = Transpose[Append[Transpose[#], RandomReal[1, Length[#]]] &@directions];

Grid[data, Frame -> All, Alignment -> Left]

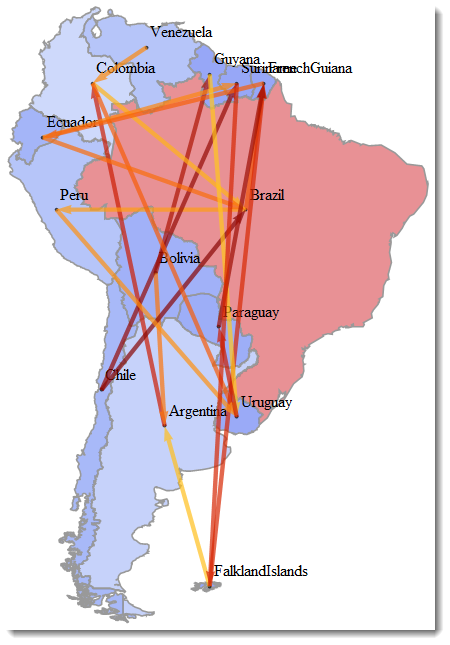
An obvious thing to do is to plot this graph in a geographical layout of the countries. The lighter the color of the edge, the greater is the inflow. I also color countries according to population:
Show[
 Graphics[{EdgeForm[GrayLevel[.6]], Opacity[.5],
     ColorData["TemperatureMap"][
      CountryData[#, "Population"]/1.95423`*^8],
     CountryData[#, "Polygon"]} & /@ CountryData["SouthAmerica"]],
 Graph[
  countries,
  flows,
  EdgeWeight -> data[[All, 3]],
  EdgeStyle ->
   MapThread[
    Rule, {flows,
     Directive[ColorData["SolarColors"][#], Thickness[.01]] & /@
      data[[All, 3]]}],
  VertexLabels -> "Name",
  VertexCoordinates -> (Reverse[
       CountryData[#, "CenterCoordinates"]] & /@
     CountryData["SouthAmerica"]),
  EdgeShapeFunction ->
   GraphElementData[{"FilledArrow", "ArrowSize" -> .035}]
  ]
 ]

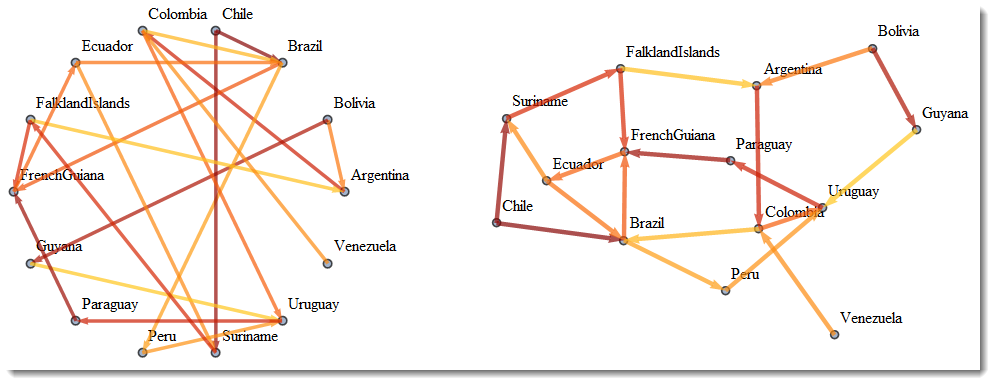
You may also try other layouts - coming from graph properties:
Graph[
   countries,
   flows,
   EdgeWeight -> data[[All, 3]],
   EdgeStyle ->
    MapThread[
     Rule, {flows,
      Directive[ColorData["SolarColors"][#], Thickness[.01]] & /@
       data[[All, 3]]}],
   VertexLabels -> "Name",
   EdgeShapeFunction ->
    GraphElementData[{"FilledArrow", "ArrowSize" -> .035}],
   GraphLayout -> #,
   ImagePadding -> 40] & /@
     {"CircularEmbedding", "SpringElectricalEmbedding"}//Row


DirectedEdge[]and theEdgeWeightoption ofGraph[]. If you want a demo of how you can use these; please include a (small) example. $\endgroup$dataFile = Import["T10.xls"]I suggest working first with a small number of records till you get a feel for how the data are organized. $\endgroup$