3
$\begingroup$

I've been playing around with some d-orbitals and have been trying to view their maximum in two dimensions. At the moment I've progressed to the point where the d__ orbitals are superimposed onto one another, in 2d, using a modification of Jens' answer here but have not managed to obtain the outline. Please pardon the code, its probably a bit convoluted and ever so slightly messy:

{rMin[n_, l_], rMax[n_, l_]} = r /. Simplify[Solve[(l (l + 1))/r^2 - 2/r == -(1/n^2), r], n > 0];

sphericalToCartesian = Thread[{r, θ, ϕ} -> {Sqrt[x^2 + y^2 + z^2], ArcCos[z/Sqrt[x^2 + y^2 + z^2]], Arg[x + I y]}];

(*The radial orbitals here are approximated using a Slater-type orbital using Clementi's atomic constants for Fe; see Slater-type orbitals on Wikipedia for further information*)
pimp[n_, l_, m_][r_, θ_, ϕ_] := (2*22.27)^n ((2*22.27)/(2 n)!) (r^(n - 1)) (E^(-22.27 r)) (Im[SphericalHarmonicY[l, m, θ, ϕ]] + Im[SphericalHarmonicY[l, -m, θ, ϕ]])
pimn[n_, l_, m_][r_, θ_, ϕ_] := (2*22.27)^n ((2*22.27)/(2 n)!) (r^(n - 1)) (E^(-22.27 r)) (Im[SphericalHarmonicY[l, m, θ, ϕ]] - Im[SphericalHarmonicY[l, -m, θ, ϕ]])
prep[n_, l_, m_][r_, θ_, ϕ_] := (2*22.27)^n ((2*22.27)/(2 n)!) (r^(n - 1)) (E^(-22.27 r)) (Re[SphericalHarmonicY[l, m, θ, ϕ]] + Re[SphericalHarmonicY[l, -m, θ, ϕ]])
pren[n_, l_, m_][r_, θ_, ϕ_] := (2*22.27)^n ((2*22.27)/(2 n)!) (r^(n - 1)) (E^(-22.27 r)) (Re[SphericalHarmonicY[l, m, θ, ϕ]] - Re[SphericalHarmonicY[l, -m, θ, ϕ]])

(*To get a 2d plot, I set the earlier evaluation so that x->0*)
plot2dx0[f_, range_, contour_, opt : OptionsPattern[]] := RegionPlot[Evaluate[Abs[f[r, θ, ϕ] /. sphericalToCartesian]^2 >contour] /. x -> 0, {y, -range, range}, {z, -range, range}]

(*Plotting the different d-orbitals*)
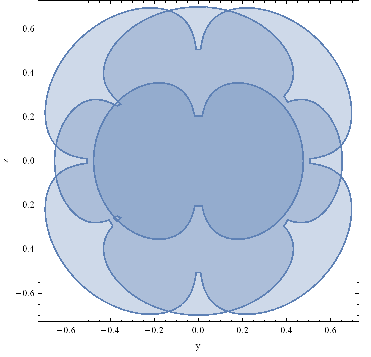
Show[plot2dx0[prep[3, 2, 0], 0.7, 0.00007], plot2dx0[pimp[3, 2, 1], 0.7, 0.00007], plot2dx0[pimn[3, 2, 2], 0.7, 0.00007], plot2dx0[pren[3, 2, 1], 0.7, 0.00007], plot2dx0[prep[3, 2, 2], 0.7, 0.00007], Frame -> True, FrameLabel -> {"y", "z"}]

(*Output*)

enter image description here

My question is then, whether it would be possible to (and how computational intensive would it be):

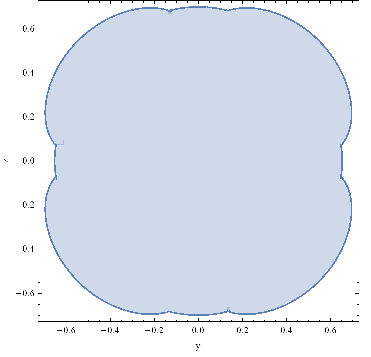
  1. Obtain only the outline of this plot for visualisation so that the distance of this outline from the centre can be quantified (probably from pi to pi/2)
  2. Plotting as a 2d density plot

For 1, it should look like:

enter image description here

For 1 & 2 I've tried the following which doesn't seem to work, and also summation of the terms (I've lost the code for that as the .nb didn't seem to save correctly on the train).

Evaluate[Max[{Abs[prep[3, 2, 0][1.12*r, θ, ϕ] /. sphericalToCartesian^2 > 0.0007],Abs[pimp[3, 2, 1][0.8*r, θ, ϕ] /. sphericalToCartesian^2 > 0.0007],Abs[pimn[3, 2, 2][1.12*r, θ, ϕ] /. sphericalToCartesian^2 > 0.0007],Abs[pren[3, 2, 1][1.12*r, θ, ϕ] /. sphericalToCartesian^2 > 0.0007],Abs[prep[3, 2, 2][1.12*r, θ, ϕ] /. sphericalToCartesian^2 > 0.0007]}]]

Could anyone please help/advise?

Many thanks, Z.

$\endgroup$
4
  • $\begingroup$ If you just want outlines, try ContourPlot[something == contour, ...] instead of RegionPlot[something > contour, ...]. $\endgroup$
    – user484
    Commented Jun 1, 2016 at 13:59
  • $\begingroup$ Hey. Just tried ContourPlot[Evaluate[something == contour] /. z -> 0}], but the output was just an empty plot, unfortunately. $\endgroup$
    – Letshin
    Commented Jun 1, 2016 at 14:47
  • 1
    $\begingroup$ Did you check this Is there something like DensityPlot3D to visualize atomic orbitals? $\endgroup$
    – Sumit
    Commented Jun 1, 2016 at 16:15
  • $\begingroup$ Hi, yes I did. I mentioned that I used a modification of Jen's answer on that question, but couldn't manage to get an outline of it. I've updated the question to show how it might look like! $\endgroup$
    – Letshin
    Commented Jun 2, 2016 at 8:58

1 Answer 1

4
$\begingroup$

Here is a way to do it based on Jens' answer.

sphericalToCartesian = Thread[{r, θ, ϕ} -> {Sqrt[x^2 + y^2 + z^2], 
                        ArcCos[z/Sqrt[x^2 + y^2 + z^2]], Arg[x + I y]}];

(*Atomic Orbitals*)
Ψ[n_, l_, m_][r_, θ_, ϕ_] := 
  Sqrt[(n - l - 1)!/(n + l)!] E^(-(r/n)) ((2 r)/n)^l 2/n^2 LaguerreL[
  n - l - 1, 2 l + 1, (2 r)/n] SphericalHarmonicY[l, m, θ, ϕ];

psi[n_, l_, m_][x_, y_, z_] = Ψ[n, l, m][r, θ, ϕ] /.sphericalToCartesian;

By definition, a wavefunction is spanned over all space. So what I am going to do is choose a trial value of the probability and plot its projection on a particular plane.

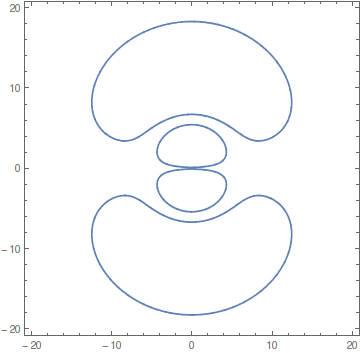
Lets choose $|\Psi[3,1,0]|^2=0.005$ at $x=0$ plane .

ContourPlot[Abs[psi[3, 1, 0][0, y, z]] == 0.005,
              {y, -20, 20}, {z, -20, 20}, MaxRecursion -> 5]

cross-section

To get the optimum value for the probability you can use Jens' {rMin,rMax} with the radial part

{rMin[n_, l_], rMax[n_, l_]} = r /. Simplify[Solve[(l (l + 1))/r^2 
                                - 2/r == -(1/n^2), r], n > 0];
pMax[n_,l_] = Abs[Ψ[n, l, 0][rMax[n,l], 0, 0]];

pMax[3,1]//N

0.00644596

$\endgroup$
5
  • $\begingroup$ Thanks @J.M. for the correction before Jens saw that :) $\endgroup$
    – Sumit
    Commented Jun 2, 2016 at 12:28
  • $\begingroup$ Now that comment made me curious... $\endgroup$
    – Jens
    Commented Jun 2, 2016 at 14:23
  • 1
    $\begingroup$ @Jens, I'll keep that in mind the next time I need to use your name in the possessive form. (OTOH, the rule I'm accustomed to uses 's for most singular nouns even when they end in s, with a few notable exceptions.) $\endgroup$ Commented Jun 2, 2016 at 14:42
  • $\begingroup$ Many thanks for the answer. In the context of your answer, would it be possible to obtain the outline of superimposed plots (say, combining psi[3, 1, 0], psi[3, 1, 1] and psi[3, 1, 2]); that is, the maximum of the d__ orbitals at any one point (as seen in the attached image above), or to stack the d__ orbitals on top of one another, thereby forming a 'density' plot? @Jens... Oops, I made the mistake of the confused apostrophe as well :( Sorry... $\endgroup$
    – Letshin
    Commented Jun 2, 2016 at 17:31
  • $\begingroup$ DensityPlot[Abs[ psi[n1, l1, 0][0, y, z] + psi[n2, l2, 0][0, y, z] ], ...] should work. You can use different weight for each wavefunction if you want. $\endgroup$
    – Sumit
    Commented Jun 3, 2016 at 11:37

Your Answer

By clicking “Post Your Answer”, you agree to our terms of service and acknowledge you have read our privacy policy.

Not the answer you're looking for? Browse other questions tagged or ask your own question.