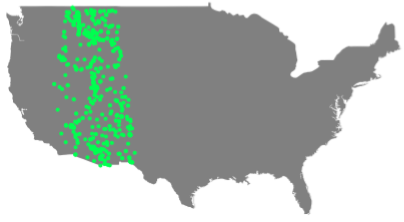
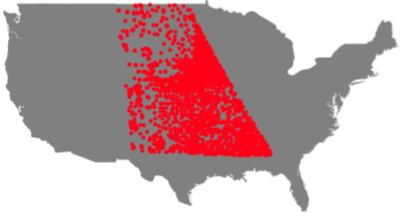
How can I plot different sets of coordinates with different colors? For example, the two maps below would be merged into one map, with two colors.
I'm using the commands below to create the maps below - the coordinates are comma-separated and stored in input files.
latlong = Import["cluster0.txt", "CSV"];

Graphics[{Gray,  Polygon[Map[GeoGridPosition[GeoPosition[#], "Mercator"][[1]] &, CountryData["United States", "Coordinates"], {2}]], Red,  PointSize[.01], Point /@ Map[ GeoGridPosition[GeoPosition[#], "Mercator"][[1]] &, {latlong}, {2}]}]

latlong2 = Import["cluster2.txt", "CSV"];

Graphics[{Gray,  Polygon[Map[GeoGridPosition[GeoPosition[#], "Mercator"][[1]] &, CountryData["United States", "Coordinates"], {2}]], Green,  PointSize[.01], Point /@ Map[ GeoGridPosition[GeoPosition[#], "Mercator"][[1]] &, {latlong2}, {2}]}]
(Update:) I am using Mathematica version 8 so I would prefer solutions that work with this version.


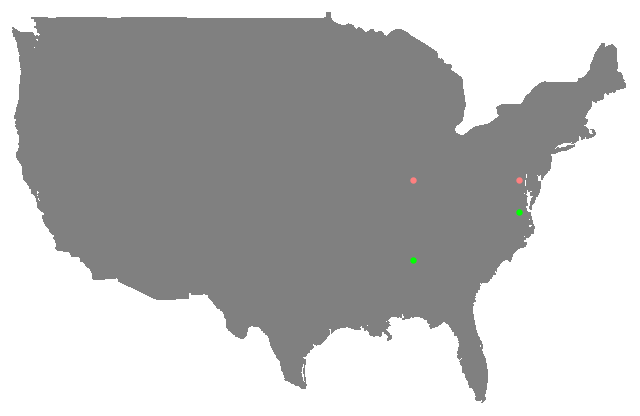
Green, PointSize[.01], Point /@...to your firstGraphicscall, see my answer below. $\endgroup$