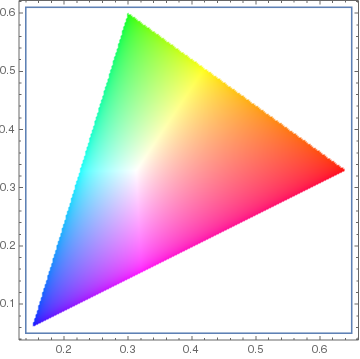
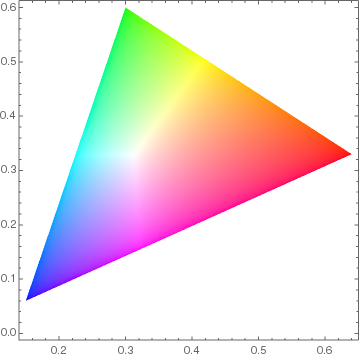
I'm making a composite 2D plot, combining different types of plots (Graphics, ListPlot etc.) with Show. One layer of the plots contains a polygon filled with colors which depend on the 2D coordinates on the polygon. (The vertices of the polygon are {{0.6400744901465835, 0.3299704937157755}, {0.29999999497269986, 0.5999999722714001}, {0.15001662467009716, 0.060006658004021524}}.)
To draw the polygon, I first thought of using ColorFunction with DensityPlot, but it appeared to only receive the value of the function itself, not the coordinates. My next attempt was with RegionPlot, which does get the coordinates. This looks like the following code.
(* Functions to calculate color from x and y coordinates *)
xyY2XYZ[x_, y_, Y_] = {(x Y)/y, Y, -(((-1 + x + y) Y)/y)};
normalize[x_] := x/Max@x
XYZ2sRGB[c_] := (normalize[( {
      {3.2406255, -1.537208, -0.4986286},
      {-0.9689307, 1.8757561, 0.0415175},
      {0.0557101, -0.2040211, 1.0569959}
     } ).c])^(1/2.2)
(* Actual plotting *)
RegionPlot[True, {x, 0.14, 0.65}, {y, 0.05, 0.61},
 ColorFunction ->
  Function[{x, y},
   RGBColor[
    If[Max@Abs@Im@# != 0, {1, 1, 1}, Re@#] &@
     XYZ2sRGB@xyY2XYZ[x, y, 1]]], ColorFunctionScaling -> False,
 PlotPoints -> 250]
But I had to increase PlotPoints to 250, otherwise the result was too pixelized on the border, and MaxRecursion didn't appear to affect the output. This results in long time to wait, and the border still remains jagged.
Also, the blue line between the image and the frame is an unwanted artifact.
So, what's a better way to do this?


