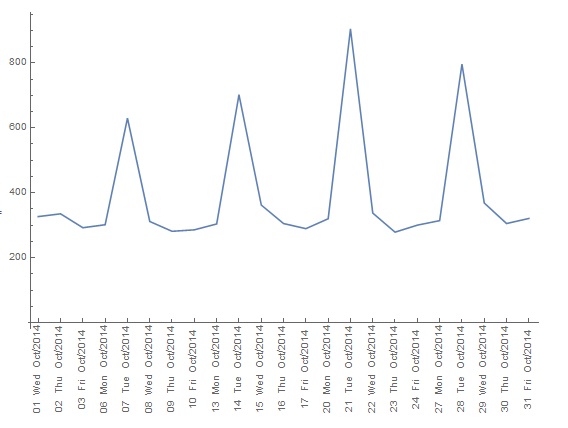
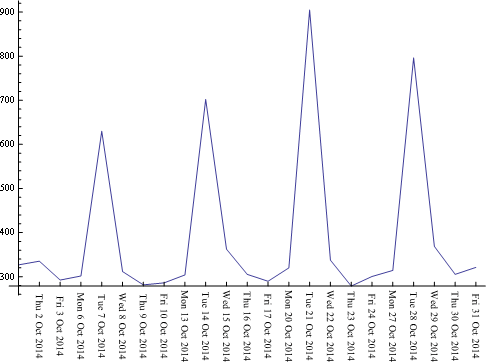
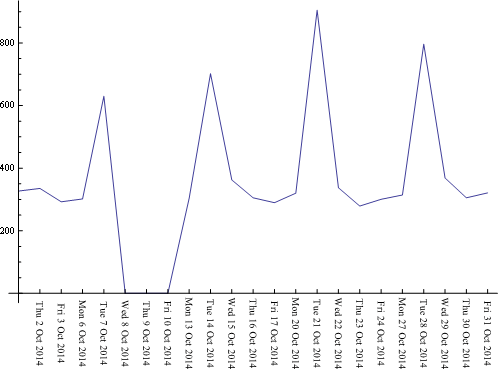
How to skip weekends in DateListPlot, ie, drawing 20 something data points for a month and not leaving 2 days gap between weeks? Currently DateListPlot occupied the actual number of days for a month and drawing a direct line between Friday and next Monday (where no weekend data available).
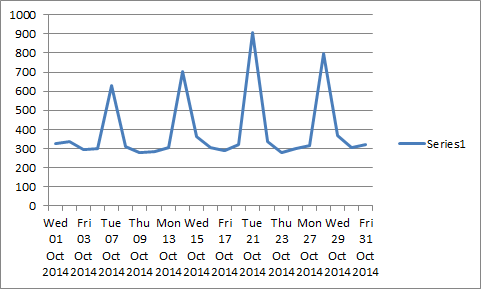
I want to draw something like this as Excel:
While I get this in Mathematica:
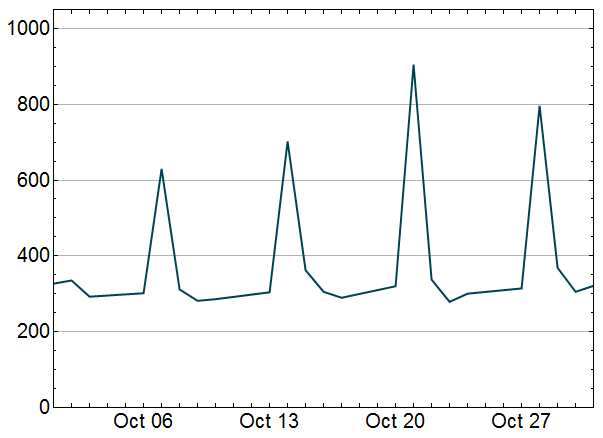
Sample data:
Dataset1 = {{{2014, 10, 1, 0, 0, 0},
326.8442322}, {{2014, 10, 2, 0, 0, 0},
335.284444}, {{2014, 10, 3, 0, 0, 0},
292.5086867}, {{2014, 10, 6, 0, 0, 0},
301.6750855}, {{2014, 10, 7, 0, 0, 0},
629.9616564}, {{2014, 10, 8, 0, 0, 0},
311.6753747}, {{2014, 10, 9, 0, 0, 0},
281.5024327}, {{2014, 10, 10, 0, 0, 0},
285.9985823}, {{2014, 10, 13, 0, 0, 0},
304.0455324}, {{2014, 10, 14, 0, 0, 0},
702.0810431}, {{2014, 10, 15, 0, 0, 0},
362.4479495}, {{2014, 10, 16, 0, 0, 0},
305.3800495}, {{2014, 10, 17, 0, 0, 0},
289.6995727}, {{2014, 10, 20, 0, 0, 0},
320.0506679}, {{2014, 10, 21, 0, 0, 0},
904.8753329}, {{2014, 10, 22, 0, 0, 0},
337.5214556}, {{2014, 10, 23, 0, 0, 0},
278.8865421}, {{2014, 10, 24, 0, 0, 0},
300.4519167}, {{2014, 10, 27, 0, 0, 0},
314.3109259}, {{2014, 10, 28, 0, 0, 0},
796.3015273}, {{2014, 10, 29, 0, 0, 0},
368.7108282}, {{2014, 10, 30, 0, 0, 0},
305.3858455}, {{2014, 10, 31, 0, 0, 0}, 321.1488558}};

g1 = DateListPlot[Dataset1, PlotRange -> {0, 1050}]

