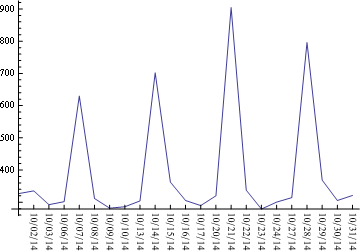
added 626 characters in body
Source Link
Dr. belisarius
  • 116.2k
  • 13
  • 205
  • 456
ListLinePlot[d1[[All, 2]], PlotRange -> All, 
 Ticks -> {Transpose[{Range@Length@d1, Rotate[#, -Pi/2] & /@ (DateString[#, "DateShort"] 
           & /@ d1[[All, 1]])}], Automatic}]
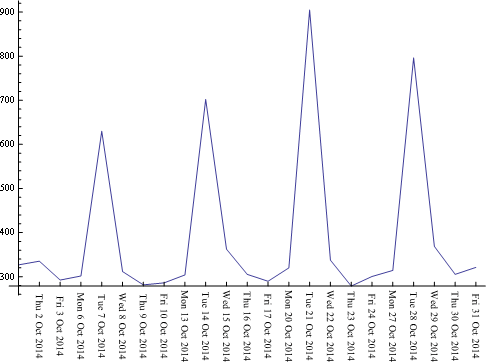
Mathematica graphics

if your list contains "holes", you'll need to fill them up for the plot to be meaningful:

d2 = Join[d1[[;; 5]], d1[[9 ;;]]];
r = DateRange[d2[[All, 1]][[1, ;; 3]], d2[[All, 1]][[-1, ;; 3]]]
d3 = SortBy[Join[d2, {#, 0} & /@ Select[Complement[r, d2[[All, 1, ;; 3]]], 
     DayName@# != Sunday && DayName@# != Saturday &]], AbsoluteTime[#[[1]]] &]
ListLinePlot[d3[[All, 2]], PlotRange -> All, 
 Ticks -> {Transpose[{Range@Length@d3, Rotate[#, -Pi/2] & /@ (DateString[#, "DateShort"] & /@ 
        d3[[All, 1]])}], Automatic}]
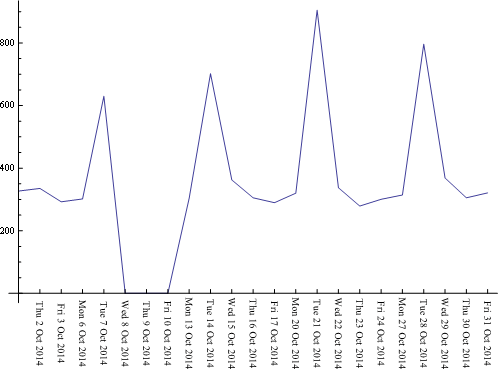
Mathematica graphics

ListLinePlot[d1[[All, 2]], PlotRange -> All, 
 Ticks -> {Transpose[{Range@Length@d1, Rotate[#, -Pi/2] & /@ (DateString[#, "DateShort"] 
           & /@ d1[[All, 1]])}], Automatic}]

Mathematica graphics

ListLinePlot[d1[[All, 2]], PlotRange -> All, 
 Ticks -> {Transpose[{Range@Length@d1, Rotate[#, -Pi/2] & /@ (DateString[#, "DateShort"] 
           & /@ d1[[All, 1]])}], Automatic}]

Mathematica graphics

if your list contains "holes", you'll need to fill them up for the plot to be meaningful:

d2 = Join[d1[[;; 5]], d1[[9 ;;]]];
r = DateRange[d2[[All, 1]][[1, ;; 3]], d2[[All, 1]][[-1, ;; 3]]]
d3 = SortBy[Join[d2, {#, 0} & /@ Select[Complement[r, d2[[All, 1, ;; 3]]], 
     DayName@# != Sunday && DayName@# != Saturday &]], AbsoluteTime[#[[1]]] &]
ListLinePlot[d3[[All, 2]], PlotRange -> All, 
 Ticks -> {Transpose[{Range@Length@d3, Rotate[#, -Pi/2] & /@ (DateString[#, "DateShort"] & /@ 
        d3[[All, 1]])}], Automatic}]

Mathematica graphics

deleted 47 characters in body
Source Link
Dr. belisarius
  • 116.2k
  • 13
  • 205
  • 456
ListLinePlot[d1[[All, 2]], PlotRange -> All, 
 Ticks -> {Transpose[{Range@Length@d1, 
            Rotate[#, -Pi/ 2] & /@ (DateString[#, {"Month", "/", "Day", "/","DateShort"] 
           "YearShort"}] & /@ d1[[All, 1]])}], Automatic}]

Mathematica graphicsMathematica graphics

ListLinePlot[d1[[All, 2]], PlotRange -> All, 
 Ticks -> {Transpose[{Range@Length@d1, 
            Rotate[#, -Pi/ 2] & /@ (DateString[#, {"Month", "/", "Day", "/", 
           "YearShort"}] & /@ d1[[All, 1]])}], Automatic}]

Mathematica graphics

ListLinePlot[d1[[All, 2]], PlotRange -> All, 
 Ticks -> {Transpose[{Range@Length@d1, Rotate[#, -Pi/2] & /@ (DateString[#, "DateShort"] 
           & /@ d1[[All, 1]])}], Automatic}]

Mathematica graphics

Source Link
Dr. belisarius
  • 116.2k
  • 13
  • 205
  • 456

ListLinePlot[d1[[All, 2]], PlotRange -> All, 
 Ticks -> {Transpose[{Range@Length@d1, 
            Rotate[#, -Pi/ 2] & /@ (DateString[#, {"Month", "/", "Day", "/", 
           "YearShort"}] & /@ d1[[All, 1]])}], Automatic}]

Mathematica graphics